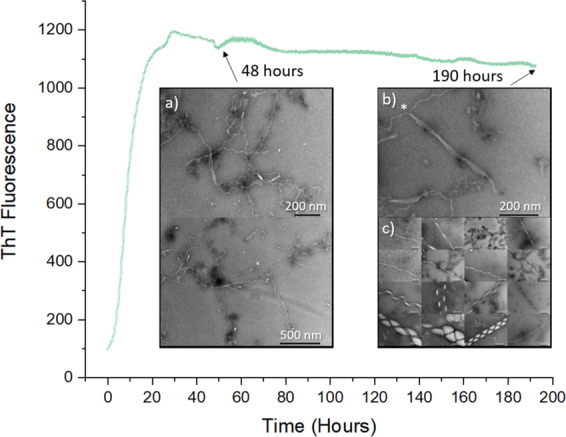
Fig. 2. Lipid-induced αS aggregation followed by ThT fluorescence.

Aggregation of 100 μM αS in the presence of 200 μM DMPS lipid vesicles at 30 °C, followed by ThT fluorescence and TEM. a TEM samples taken at 48 h show the formation of meandering fibril-like structures growing from the surface of punctate lipid vesicles. These are observed to be ~5 nm in width and straight, or ~10 nm in width (Supplementary Fig. 3). b TEM samples taken at ≈190 h show two meandering 10 nm fibrils fusing to form a 40-nm-wide ribbon-like structure*. c TEM samples observed at ≈190 h display a range of macromolecular polymorphs (image is shown in more detail in Fig. 1).
