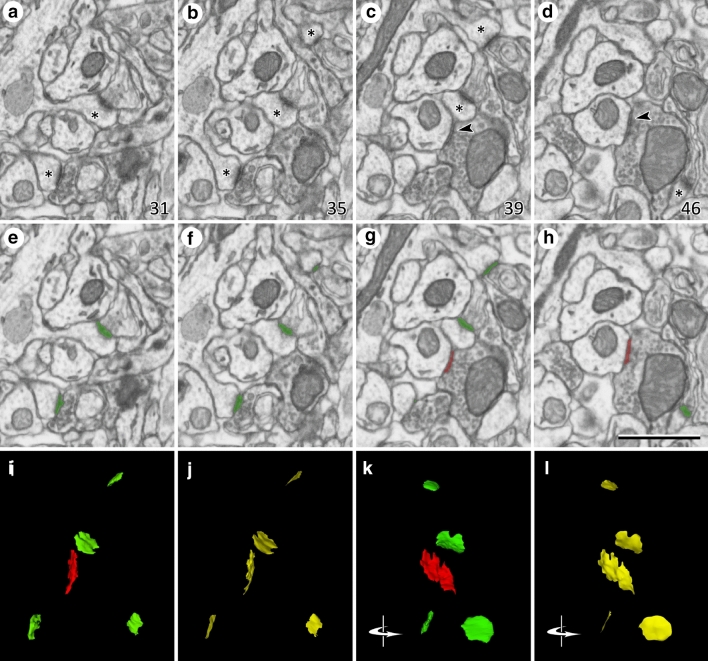
Figure 3.
Identification and segmentation of synaptic junctions in serial sections acquired by FIB-SEM. (a–c) Detail of four electron micrographs selected from a series o images obtained by FIB-SEM. In this example, the stack of images was obtained from the stratum oriens. The numbers in the bottom-right corner correspond to section number. Four asymmetric synapses can be identified by the presence of prominent post-synaptic densities in (a–d) (asterisks). One symmetric synapse, with a thin post-synaptic density, can be seen in (c) and (d) (arrow heads). Note that the classification of synapses as asymmetric or symmetric is not based on single images but on the examination of the full sequence of images. (e–h) The same images after they have been segmented with Espina software (https://cajalbbp.es/espina/). The segmentation process is based on grey-level thresholds, so the resulting 3D objects comprise both the pre- and post-synaptic densities (see “Material and Methods”). Green profiles correspond to asymmetric synapses and red profiles to the symmetric synapse. (i) 3D rendering of the synaptic junctions present in (a–h). (j) Synaptic apposition surfaces (SAS, yellow) extracted from the 3D segmentations represented in (i). SAS are automatically extracted from the 3D reconstructions of synaptic junctions (see “Material and Methods”); they are zero-volume surfaces that represent the interface between the pre- and post-synaptic densities. The surface area of the SAS is measured for each individual synaptic junction. (k, l) Same structures represented in (i) and (j), respectively, after they have been rotated through a vertical axis. Original images were acquired with a resolution of 5 nm/pixel, with a distance of 20 nm between two consecutive images. Calibration bar in (h) is 1 µm.

