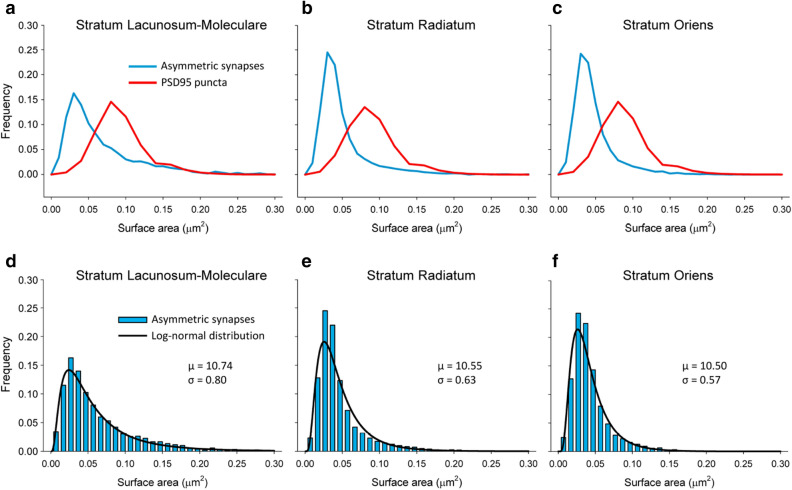
Figure 7.
Frequency histograms of the sizes of PSD95 puncta and asymmetric synapses. (a–c) Comparison of the distribution of the surface areas of PSD95 puncta acquired by SDM (red line) and the synaptic apposition surfaces of asymmetric synapses reconstructed from FIB-SEM samples (blue line) from three layers of the CA1 region of the hippocampus. The histograms corresponding to asymmetric synapses are narrower and lie to the left of the histograms corresponding to PSD95 puncta. (d–f) Frequency histograms (blue bars) of the areas of the synaptic apposition surfaces of asymmetric synapses reconstructed from FIB-SEM samples. The log-normal distributions (black lines) represent the theoretical probability density functions that best fit the experimental data. The parameters µ and σ of the corresponding log-normal distributions have also been indicated.

