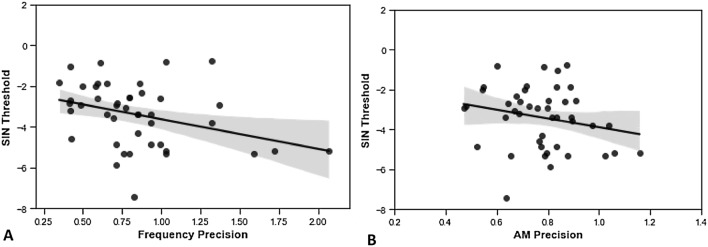
Figure 1.
Relationships between SiN performance and the auditory WM measures. Black dots show the results from individual participants and the black lines show the least squares lines of best fit. The grey shaded areas shows the standard error. Confidence intervals for the correlation coefficients were calculated by performing bootstrapping with 1,000 samples. (A) Better SiN ability (lower thresholds) is significantly correlated with higher frequency WM precision [ρ = − 0.36 (CI − 0.622 to − 0.061), p = 0.016]. (B) There was no significant association between SiN ability and AM WM precision [r = − 0.22 (CI − 0.482 to 0.129), p = 0.154].

