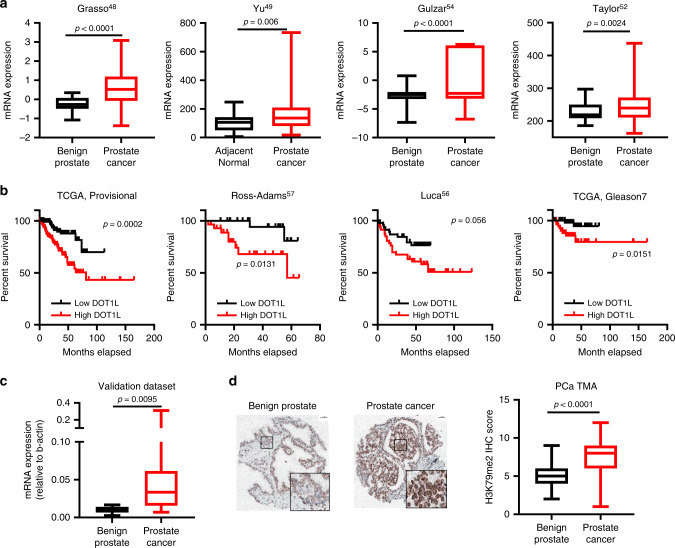
Fig. 1. DOT1L expression is upregulated in prostate cancers and high expression correlates with poor disease-free survival.
a Comparison of DOT1L expression in four cohorts of prostate cancer patients’ datasets. Data for this analysis were used from the Grasso PCa dataset [benign (n = 28), PCa (n = 94)], Yu PCa dataset [normal (n = 60), PCa (n = 81)], Gulzar Prostate cancer dataset [normal (n = 66), prostate cancers (n = 83) and Taylor PCa dataset [normal (n = 29), PCa (n = 150)]. b Disease-free Survival analysis of three independent cohorts of prostate cancer patients divided by expression of DOT1L using 25 percentile and 75 percentile cutoffs. Data was used from the Luca CancerMap prostate cancer dataset [n = 46 per group], TCGA prostate cancer dataset [n = 122 per group], Ross-Adams Discovery dataset [n = 27 per group] and TCGA Gleason 7 patients [n = 61 per group]. c Comparison of DOT1L expression in an independent dataset with PCa patient specimens [benign (n = 15), PCa (n = 45)]. d Representative images (left) and comparison of average H3K79me2 staining scores in tissue sections from a PCa TMA [normal (n = 80), PCa (n = 80)] Scale bar indicates 50 μM. Statistical tests: p value determined by two-sided Welsh’s t test (a, c, d) and Log-rank test. For box plots, minima and maxima values are shown (a, c, d).

