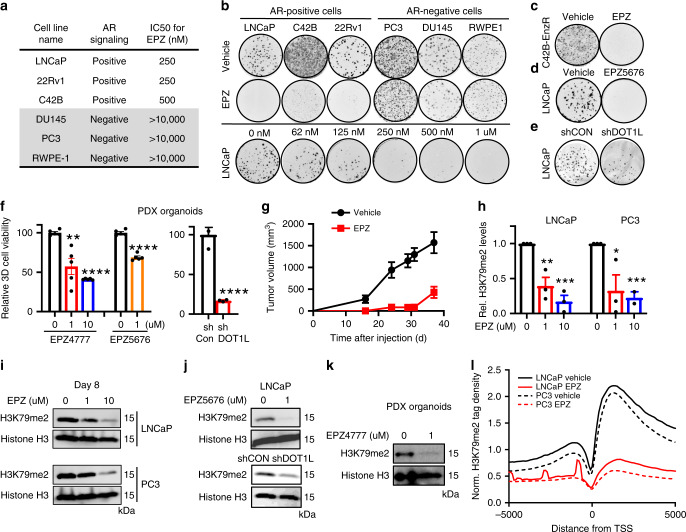
Fig. 2. DOT1L inhibition leads to selective loss in cell viability in AR-positive cells.
a Comparison of Half maximum inhibitory concentration (IC50) for EPZ in 6 prostate cancer cell lines. b (Top) Representative images of clonogenic assays performed for 6 prostate cancer cell lines treated with Vehicle or 10 μM of EPZ for 12 days from 3 independent experiments. (Bottom) Representative images of clonogenic assay in LNCaP cells treated with increasing doses of EPZ for 12 days from 3 independent experiments. Colony formation assays performed in (c) C42B-ENZR cells treated with Vehicle or 10 μM EPZ for 12 days. (d) LNCaP cells treated with Vehicle or 10 μM EPZ5676 for 12 days. e LNCaP cells transduced with shControl or shDOT1L followed by clonogenic assays evaluated after 12 days. f PDX organoids were treated with Vehicle, EPZ (left) or shControl or shDOT1L (middle) and Vehicle or EPZ5676 (right). g LNCaP cells were treated in vitro with Vehicle or 10 μM EPZ and 2 million viable cells were injected subcutaneously in NOD-SCID mice and tumor growth was monitored (n = 5 per arm). h, i H3K79me2 western blot analysis performed after 8 days of treatment with Vehicle or EPZ with quantitation of protein levels. j H3K79me2 western blot analysis in LNCaP after 8 days of treatment with (top) Vehicle or EPZ5676, (bottom) shControl or shDOT1L (Representative experiment shown). k H3K79me2 western blot analysis in PDX organoids after 8 days of treatment with Vehicle or 1 μM EPZ. l Histogram of H3K79me2 tags (within 10 kb) centered on the TSS in LNCaP and PC3 Vehicle and EPZ-treated samples. ChIP-seq performed after cells were treated for 8 days with Vehicle or 1 μM EPZ. Statistical tests: p value determined by two-tailed Student’s t test (f–h). n = 5 (f, g) and n = 3 (h–j) independent experiments. Error bars represent S.E.M. *p < 0.05; **p < 0.01; ***p < 0.001; ****p < 0.0001.

