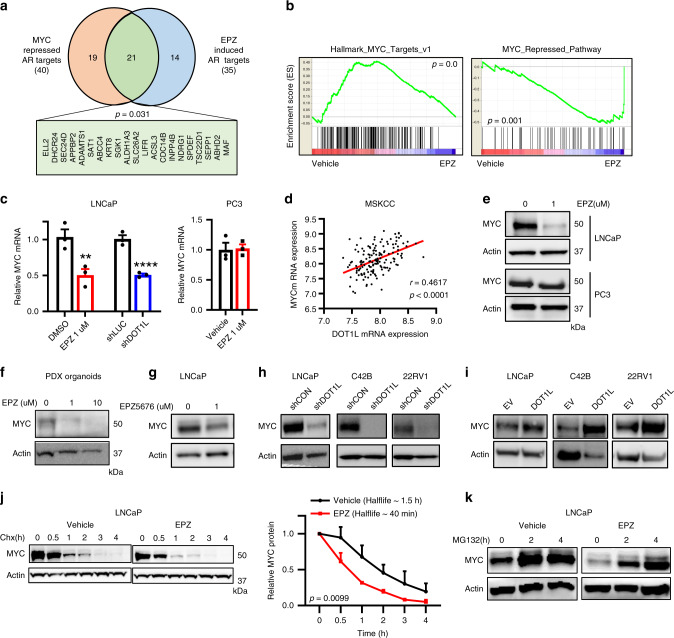
Fig. 4. DOT1L inhibition leads to impairment of MYC pathway.
a Comparison of leading-edge genes from Nelson_Response_To_Androgen dataset in the present study (n = 35) and Barfeld study (n = 40). b GSEA plots of two MYC related datasets enriched in either Vehicle treated (left) or EPZ-treated (right) LNCaP cells. Cells were treated with 1 μM Vehicle or EPZ for 8 days prior to microarray analysis (n = 3). c mRNA expression of MYC in (left) LNCaP cells treated with Vehicle or 1 μM EPZ and LNCaP cells transduced with shControl or shDOT1L lentivirus; (right) PC3 cells treated with Vehicle or 1 μM EPZ for 8 days. d Positive correlation between DOT1L and MYC expression in the MSKCC dataset (n = 150). Data were obtained from cbioportal.org. e Western blot analysis of MYC protein in LNCaP and PC3 cells treated with Vehicle or EPZ 1 μM for 8 days. Representative images shown. Western blot analysis of MYC protein in (f) PDX organoids treated with EPZ for 8 days, g LNCaP cells treated with EPZ5676 for 8 days, h LNCaP, C42B, and 22rv1 cells with DOT1L knockdown and i LNCaP, C42B, and 22rv1 cells with DOT1L overexpression. Representative images shown. j Western blot analysis and quantitation of MYC protein after treatment with 50 ug/ml Cycloheximide in LNCaP cells treated with vehicle or 1 μM EPZ for 8 days. k Western blot analysis of MYC protein after treatment with 10 μM MG-132 in LNCaP cells treated with vehicle or 1 μM EPZ for 8 days. Representative images shown. Statistical tests: p value determined by Hypergeometric test (a), Spearman’s rank correlation (d), and two-tailed Student’s t test (c, j). Error bars represent S.E.M. n = 3 independent experiments (c, e–k). **p < 0.01; ****p < 0.0001.

