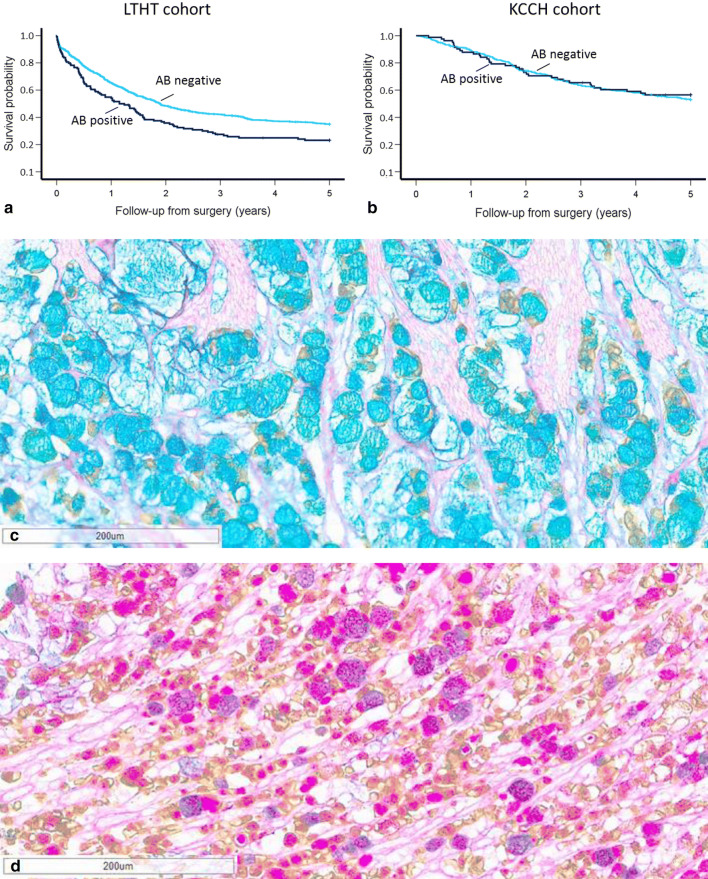
Fig. 3.
Kaplan–Meier plots showing probability of 5-year survival stratified by AB expression and cohort a and b Kaplan–Meier survival analysis showed in the LTHT cohort significantly worse outcome in AB positive GC (p = 0.002), this was not seen in the KCCH cohort. c Example of CK-ABPAS stain showing positivity for AB (blue staining). d Example of CK-ABPAS stain showing positivity for PAS and combined AB-PAS positivity (pink and purple staining respectively)

