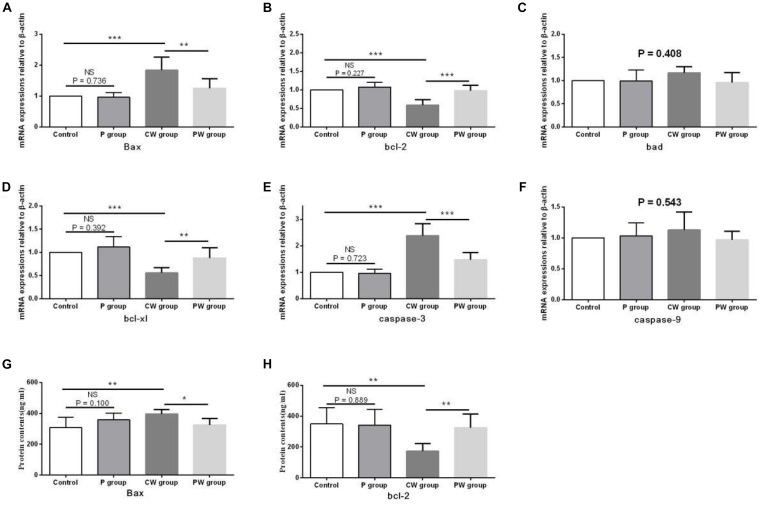
FIGURE 13.
Apoptosis-related functional protein contents and mRNA-expression levels in the hippocampus. Data are presented as the means ± SD (n = 6). NS, not significant (P > 0.05); ∗difference is significant at the 0.05 level (P < 0.05); ∗∗difference is significant at the 0.01 level (P < 0.01); ∗∗∗difference is significant at the 0.001 level (P < 0.001). (A–F) mRNA-expression levels of Bax, bcl-2, bcl-xl, Bad, caspase-9, and caspase-3, respectively, (G,H) protein contents of Bax and bcl-2.

