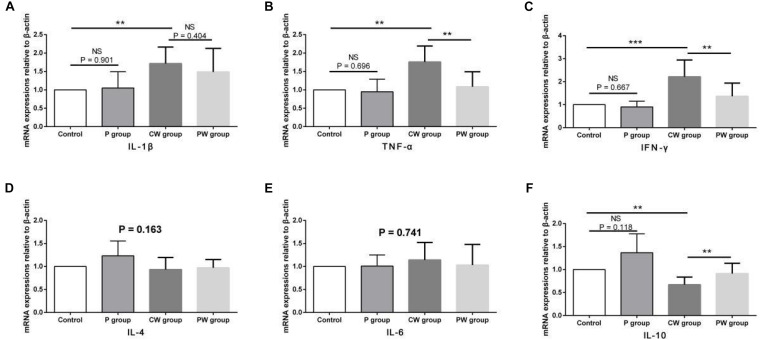
FIGURE 7.
mRNA-expression levels of inflammatory factors in the ileum. Data are presented as the means ± standard deviation (n = 6). NS, not significant (P > 0.05); **difference is significant at the 0.01 level (P < 0.01); ***difference is significant at the 0.001 level (P < 0.001). (A–F) mRNA-expression levels and protein contents of TNF-α, IFN-γ, IL-1β, IL-6, IL-4, and IL-10, respectively. TNF-α, tumor necrosis factor-alpha; INF-γ, interferon-gamma.

