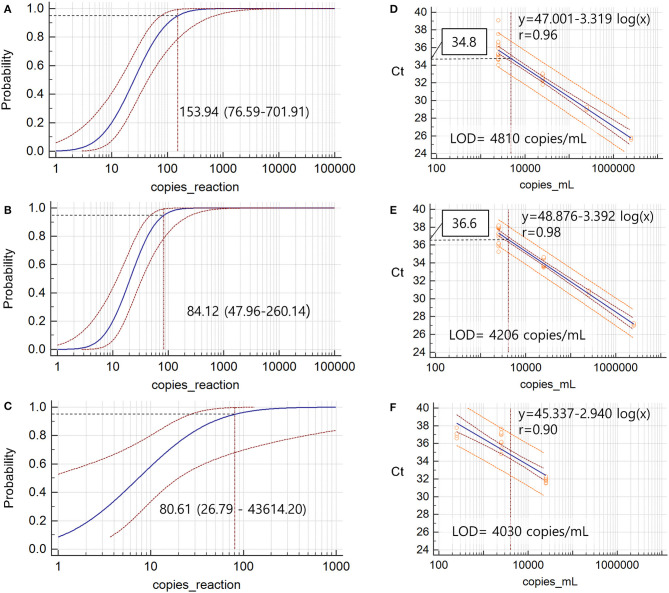
Figure 2.
The limits of detection of 95% (LOD) via probit analysis based on 20 replicates of serially diluted in vitro transcribed E RNA from SARS-CoV-2 for Allplex (A) and PowerChek (B) and 10 replicates of serially diluted purified RNA from SARS coronavirus Frankfurt1 for Real-Q (C). Black dotted lines indicated LOD and values are denoted with 95% confidence intervals in parenthesis. The correlation between Cts and viral loads was analyzed via linear regression based on LOD experiments in Allplex (D), PowerChek (E), and Real-Q (F). Open orange circles represent the results of each test. The Ct values corresponding to LOD of Allplex and PowerChek were calculated using the linear regression equation and are denoted by boxes.

