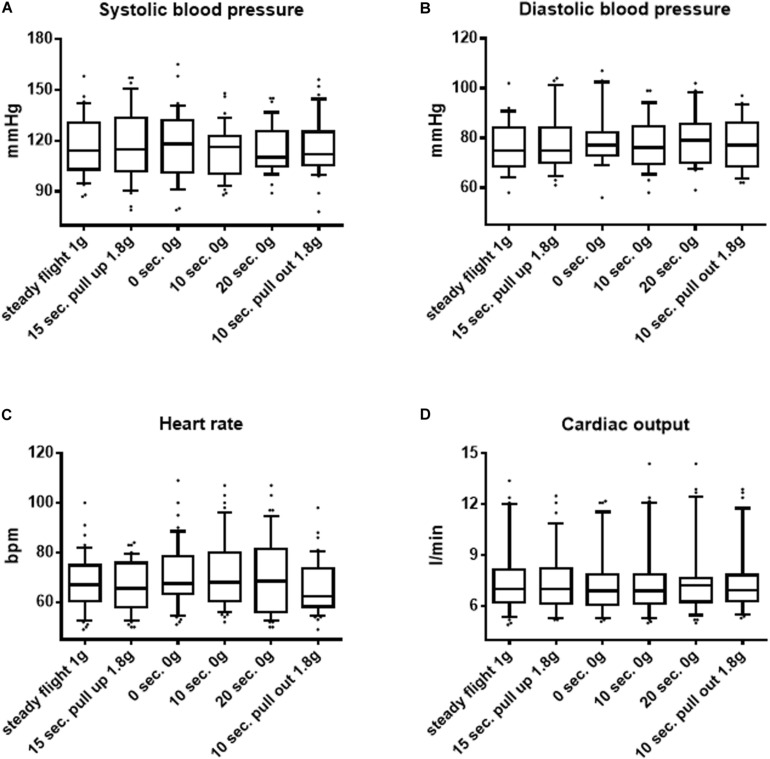
FIGURE 2.
Macrocirculatory parameters in the course of parabolic flights in the supine position. (A) Systolic blood pressure, (B) diastolic blood pressure, (C) heart rate, and (D) cardiac output changes during the course of a parabola in the supine position are shown. Data are presented as median and interquartile range (IQR). Significant differences between groups are shown (Friedman test and Dunn’s multiple comparisons post hoc test). ∗p < 0.05, ∗∗p < 0.01, ∗∗∗p < 0.001, and ∗∗∗∗p < 0.0001.

