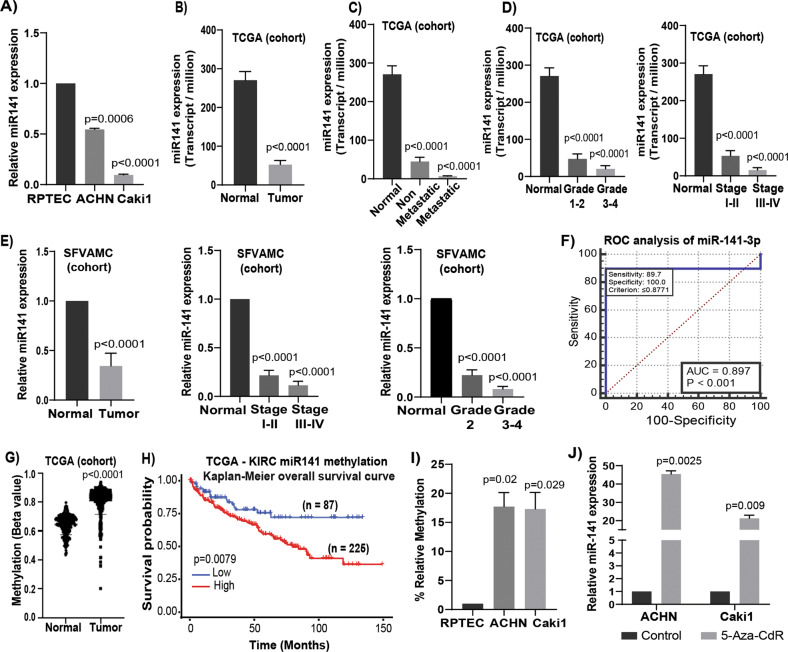
Fig. 3. Expression, clinical significance, and epigenetic regulation of miR-141 in renal cancer.
a miR-141 expression levels in ACHN, Caki1 and RPTEC cells. b Expression levels of miR-141 in KIRC-TCGA cohort (normal = 71 and tumor = 544). c Expression levels of miR-141 in normal (n = 71), non-metastatic (n = 405) metastatic (n = 77) KIRC patient samples in TCGA cohort. d Expression levels of miR-141 in KIRC-TCGA cohort among different grades (normal = 71, grade 1–2 = 297, grade 3–4 = 272) and stages (normal = 71, stage I–II = 296 and stage III–IV = 204). e Relative miR-141 expression in RCC tissue vs matched adjacent normal regions (n = 68), among different grades (normal = 68, grade 2 = 44, grade 3–4 = 22) and in different stages (normal = 68, stage I–II = 52, stage III–IV = 12) as assessed by qRT-PCR (SFVAMC cohort). f Receiver operating curve (ROC) analysis showing ability of miR-141 to differentiate between malignant and non-malignant samples. g Methylation for KIRC patient samples in TCGA-KIRC cohort for probe cg02624246. h Overall survival with TCGA-KIRC methylation as performed by Kaplan–Meier analysis. i Methylation status of miR-141 promoter in RCC cell lines compared to non-malignant RPTEC as assessed by MS-qPCR. j Expression of miR-141 in 5-Aza-CdR treated and untreated ACHN and Caki1 cell lines. Results are representative of three independent experiments. P value calculated by Student t test. Bar = mean ± standard error mean (SEM).

