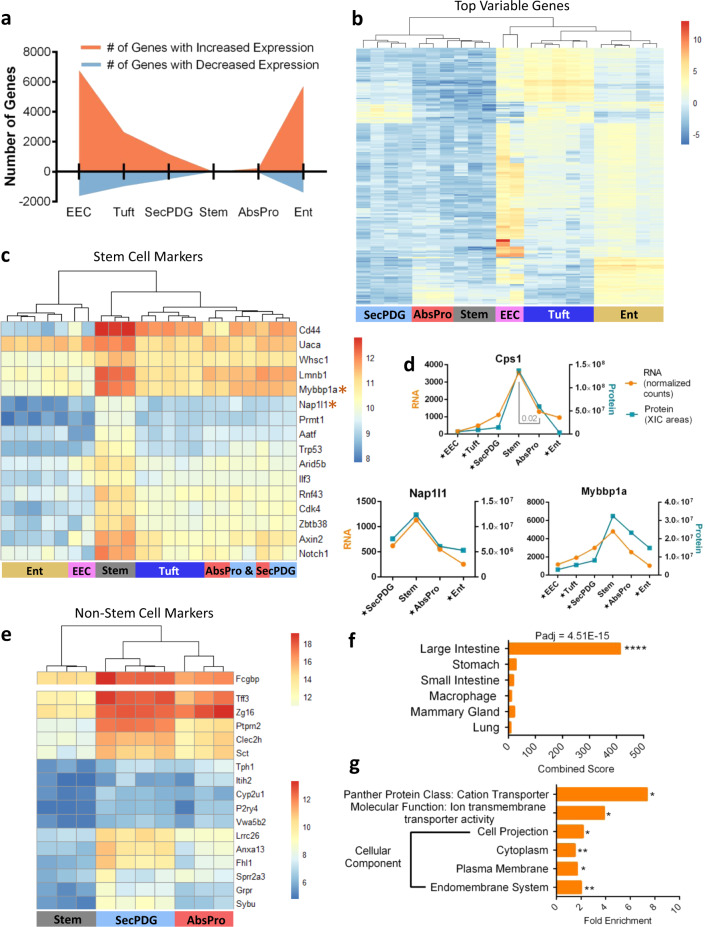
Fig. 2. Characterization of intestinal stemness based on differential gene expression.
a The number of genes that significantly change gene expression (mRNA level) between non-stem cells and stem cells; orange indicates the number of genes that increase expression and blue are the number of genes that decrease expression compared with stem (padj < 0.01 + minimum mean 50 counts). b Auto-scaled heatmap showing gene expression and unsupervised clustering of the top 200 most variably expressed genes. c Gene expression heatmap and unsupervised clustering of n = 16 genes that are significantly enriched in stem cells compared to all non-stem cells (padj < 0.01+ minimum mean 50 counts). d Examples of stem enriched markers showing both mRNA expression paired with protein expression. Star annotation by cell type symbolizes significant differential mRNA expression compared with stem (padj < 0.01). e Unsupervised clustering of genes that significantly increase in expression from stem to both SecPDG and AbsPro (8-fold change cutoff, padj < 0.01 + minimum mean count 50 counts). Upper panel: the highly expressed Fcgbp gene is reported on a separate color scale. f, g Enrichr (Mouse Gene Atlas) and Panther (cellular component analysis, molecular function, and panther protein class) gene ontology analysis of n = 107 genes that are significantly higher in expression in all non-stem cell types compared with stem cells. FDR significance is defined by: *<0.05, **<0.01, ***<0.005, ****<0.001, and analysis was performed with the following biological replicate numbers: stem = 3, AbsPro = 3, SecPDG = 4, tuft = 5, Ent = 5, and EEC = 2.

