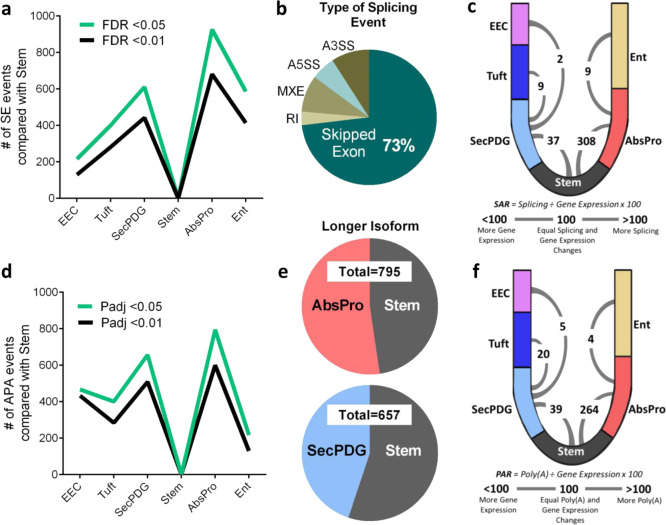
Fig. 3. A burst of alternative mRNA processing activity during loss of stemness.
a Alternative splicing analysis with rMATS determined the abundance of skipped exon events in non-stem cell types compared to stem cells. b Breakdown of average percentages of rMATS splicing changes (events) detected between stem and all non-stem cell types by type of event (SE = skipped exon, RI = retained intron, MXE = mutually exclusive exon, A5SS = Alt 5 splice site, A3SS = Alt 3 splice site) showing predominance of SE (73%) (FDR < 0.05). c Crypt diagram illustrating cell types in the secretory lineage (SecPDG, tuft, EEC) versus absorptive lineage (AbsPro, Ent). A numeric SAR (splicing abundance ratio = number of significant alternative splicing changes ÷ number of significant gene expression changes x 100) arc indicates the number of splicing changes relative to gene expression between stem, progenitors, and differentiated cells. d Alternative polyadenylation (APA) analysis with DaPars quantitated the number of APA changes (events) in non-stem cells compared with stem. e APA events characterized by which cell type has the longer 3’UTR isoform for each polyadenylated mRNA in stem versus AbsPro (top) and stem versus SecPDG (bottom) (padj < 0.05). f Crypt diagram illustrating PAR (polyadenylation abundance ratio = number of significant alternative polyadenylation changes ÷ number of significant gene expression changes × 100) comparing polyadenylation changes to gene expression between stem, progenitors, and differentiated cells. Splicing and polyadenylation analysis was performed with the following biological replicate number of mRNA-seq samples: stem = 3, AbsPro = 3, SecPDG = 4, tuft = 5, Ent = 5, and EEC = 2.

