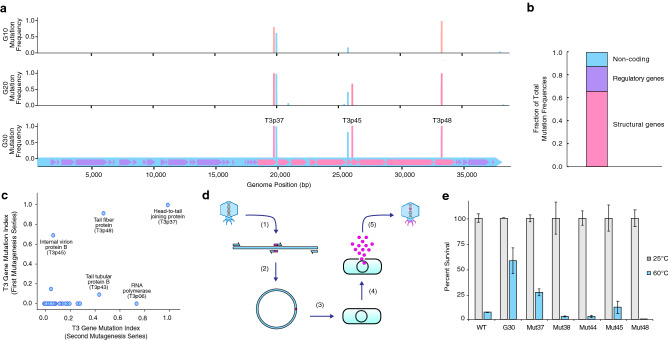
Figure 3.
Genomic changes observed in the T3 bacteriophage genome over the course of 30 applications of the CAVE protocol. (a) Mutation frequencies observed in the T3 mutant gene pools after 10, 20, and 30 rounds of directed evolution. Mutation-frequency bars are color-coded corresponding to their functional genome location where they occur: blue are non-coding regions, magenta are structural genes, and purple are regulatory genes. (b) Fraction of net mutation frequencies observed within structural genes, regulatory genes, or non-coding regions, combined from final evolved generations of all T3 mutants from first and second CAVE series. (c) Comparison of mutation frequency indices at round 20 of CAVE application for two different series of T3 mutagenesis. (d) Protocol for recapitulation of mutations at specific sites using phage-rebooting. (e) Results from recapitulation of mutations at several structural genes verify that such mutations confer improved stability.

