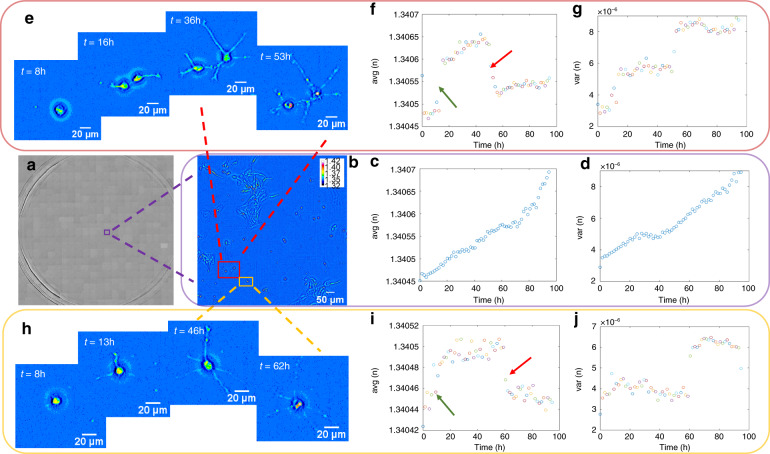
Fig. 5. Dynamic Wolf phase tomography (WPT) of live cells across multiwell plates.
a The refractive index (RI) map across a whole well of living hippocampal neurons (×10/0.3 NA objective) is composed of 20 × 21 mosaic tiles, each 214 × 204 µm2 in area. b Enlarged RI map of the purple box in (a) with the average (c) and variance (d) of the RI versus time. e Enlarged RI map of the area in the red box in (b) with the average (f) and variance (g) of the RI. The green arrow indicates the increase in the RI when the two neurons separated and their dendrites appeared, and the red arrow shows the decrease in RI when the two neurons died. h Enlarged RI map of the area in the yellow box in (b) with the average (i) and variance (j) of the RI. The green arrow indicates the change in the RI when the dendrites appeared, and the red arrow indicates the decrease in RI when the neuron died

