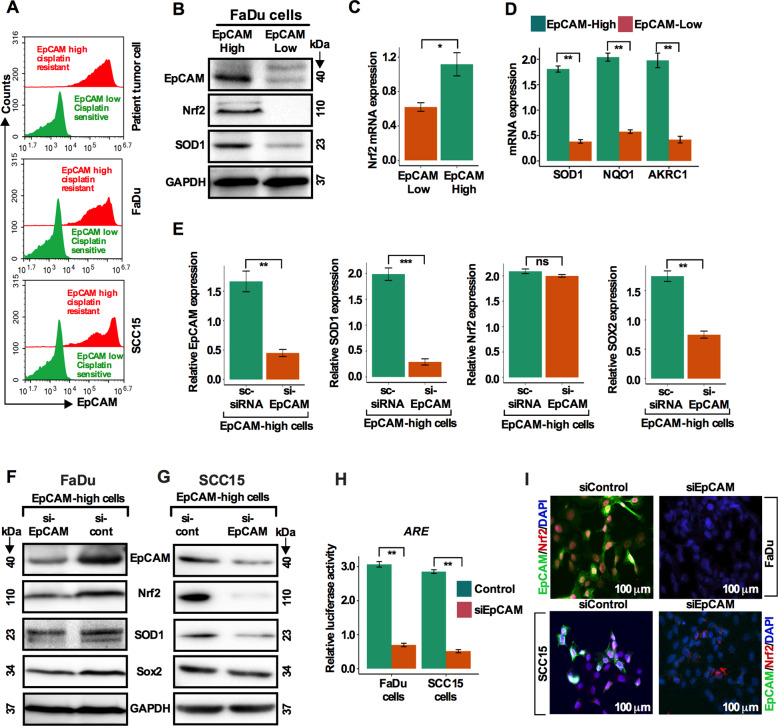
Fig. 4. Nrf2 pathway is predominantly activated in EpCAMhigh cells and EpCAM knockdown inactivates the Nrf2-ARE pathway.
a. EpCAMhigh and EpCAMlow cells were determined in HNSCC patient tumor cells, SCC15 and FaDu cells using flow cytometry. b. Total cellular protein levels of EpCAM, Nrf2, and SOD1 were determined in EpCAMhigh and EpCAMlow cells by western blot analysis. c. Nrf2 transcript levels in EpCAMhigh and EpCAMlow cells. *p < 0.05 compared to EpCAMlow group. d SOD1, NQO1, and AKRC1 transcript levels in EpCAMhigh and EpCAMlowcells. **p < 0.01 compared to EpCAMlow group. e FaDu cells were transfected with siEpCAM and scrambled siRNA and EpCAM, Nrf2, SOD1, and Sox2 transcript levels were determined by qRT-PCR analysis in EpCAMhigh cells. f, g Protein levels of EpCAM, Nrf2, SOD1, and Sox2 were determined by western blot analysis in FaDu and SCC15 HNSCC cells after silencing EpCAM in EpCAMhigh cells. h A Luciferase assay was used to detect reporter gene activity from AREs. i Immunostaining of HNSCC cells stained with EpCAM (green), Nrf2 (red), and DAPI (blue) after EpCAM knockdown. Scale bar: 100 μm.

