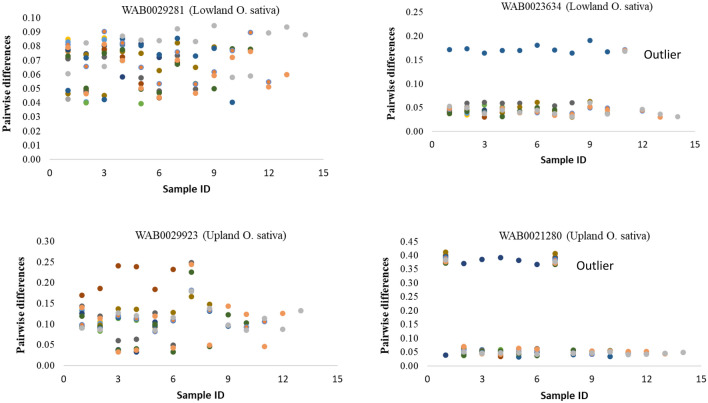
Figure 5.
A plot of identity-by-state-based genetic distance values computed within 4 accessions, each represented by 15 single plant DNA samples genotyped with 48,818 SNPs. Genetic distances between pairs of individuals within WAB0029281 and WAB0029923 were within the expected range for self-pollinated species, while WAB0023634 and WAB0021280 have outlier individuals. See Supplementary Figure S3 for 10 more accessions that had larger than expected intra-accession diversity.

