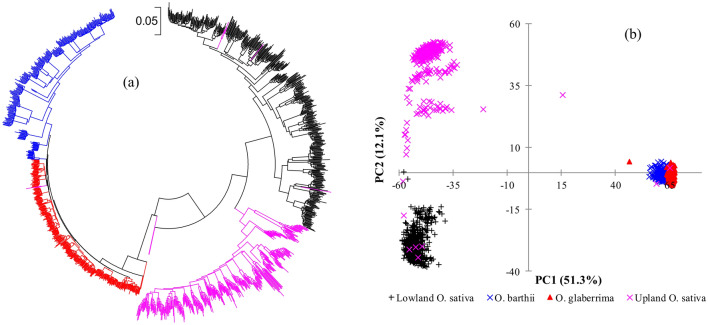
Figure 6.
(a) Neighbor-joining tree constructed using Molecular Evolutionary Genetics Analysis (MEGA) X (https://www.megasoftware.net/), and (b) plots of PC1 and PC2 from principal component analyses of 1,347 single plant DNA samples in Set-2 based on 46,818 SNPs. In both figures, samples belonging to the same group have the same font color: O. glaberrima (red), O. barthii (blue), O. sativa adapted to the upland ecology (pink) and lowland ecology (black). See Supplementary Table S1 for group membership and Supplementary Table S8 for genetic distance matrices.

