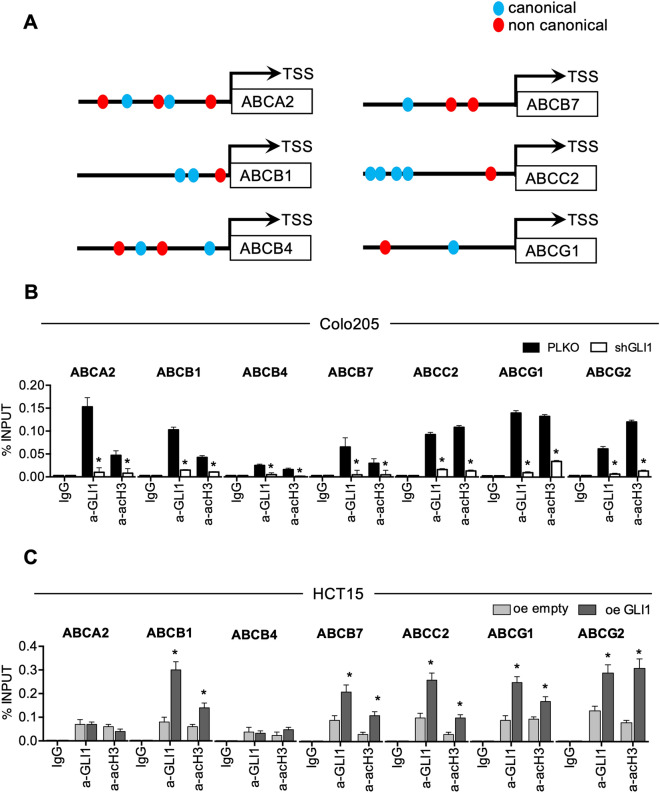
Figure 3.
(A) Schematic representation of the promoter region of the indicated ABC transporters showing locations of putative GLI1 canonical and non canonical binding sites; see supplementary Fig. 1 for detailed sequences. (B) qPCR-ChIP assay of endogenous GLI1 occupancy of the promoter region of the indicated ABC transporters in Colo205 cells after short hairpin mediated GLI1 silencing (shGLI1) versus non targeting control (PLKO) for 72 h. Immunoprecipitation with IgG was performed as control. Anti-acetyl-H3 (a-acH3) antibody was used to detect ABC transporters transcriptional activation. *p < 0.05 versus PLKO (Mann–Whitney U test). (C) qPCR-ChIP assay of overexpressed GLI1 occupancy of the promoter region of the indicated ABC transporters in HCT15 cells after GLI1 overexpression (oe GLI1) or control (oe empty) for 24 h. Immunoprecipitation with IgG was performed as control. Anti-acetyl-H3 (a-acH3) antibody was used to detect ABC transporters transcriptional activation. *p < 0.05 versus oe empty; **p < 0.01 versus oe empty (Mann–Whitney U test). (B, C) Data are means ± SD from at least 3 independent experiments. Histograms were created using GraphPad Prism version 6.0 for macOS, https://www.graphpad.com.

