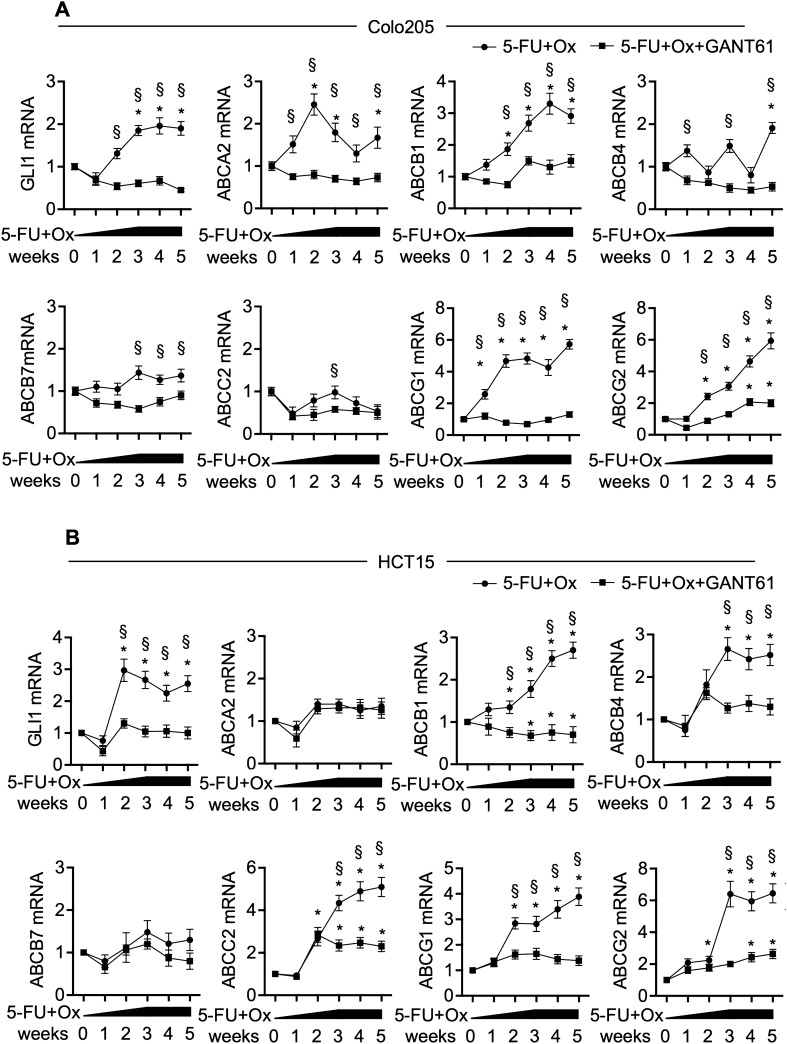
Figure 5.
(A) mRNA levels of GLI1 and indicated genes, expressed in arbitrary units, in Colo205 treated with increasing doses of 5-FU and Oxaliplatin (5-FU + Ox), starting from 1 μM to 10 μM and 10 μM GANT61 during 5 weeks. *p < 0.05 versus starting values (two-way ANOVA test). (B) mRNA levels of GLI1 and indicated genes, expressed in arbitrary units, in HCT15 treated with increasing doses of 5-FU + Ox, starting from 1 to 10 μM and 10 μM GANT61 during 5 weeks. *p < 0.05 versus starting values; §p < 0.05 5-FU + Ox versus 5-FU + Ox + GANT61 (two-way ANOVA test). Data are representative of three independent experiments, (A, B). Histograms were created using GraphPad Prism version 6.0 for macOS, https://www.graphpad.com.

