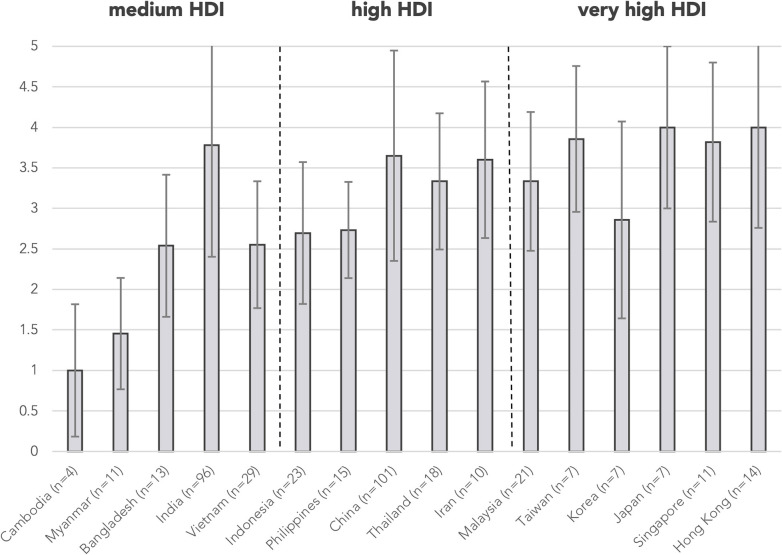
Figure 4.
Mean testing level by country/region. Testing levels are assigned according to Table 1 for each abstract. Mean testing level positively correlated with HDI by two-tailed Pearson correlation (r = 0.742, p = 0.002). Error bars show the range of ±1 S.D. of mean testing level of cases from the country/region. n is the number of abstracts from that country/region included in this analysis. Countries/regions are in ascending order according to their HDI from the left. HDI, Human Development Index.

