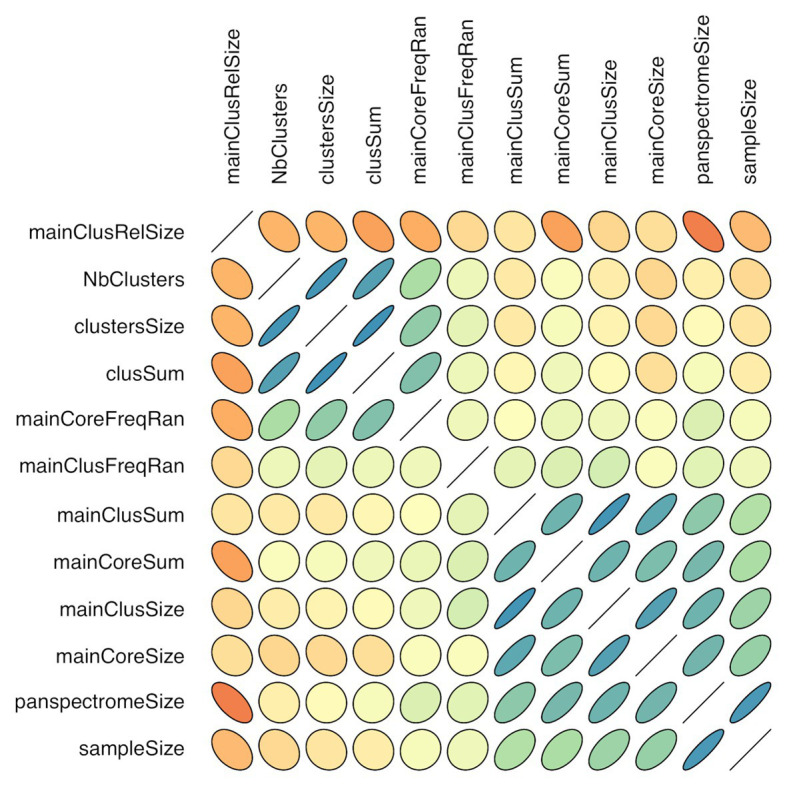
Figure 8.

Correlogram of cluster characteristics (mainClusRelSize: relative size of the main cluster; NbClusters: number of clusters; clustersSize: number of peaks included in clusters; clusSum: ion current sum of peaks included in clusters; mainCoreFreqRan: frequency range between the most and least frequent core peak; mainClusFreqRan: frequency range between the most and least frequent main cluster peak; mainClusSum: ion current sum of main cluster peaks; mainCoreSum: ion current sum of core peaks; mainClusSize: number of main cluster peaks; mainCoreSize: number of core peaks; panspectromeSize: number of distinct species peaks; SampleSize: number of included spectra). Orientation of the ellipse depends on the correlation sign, shape and color depend on the correlation value (flat shape and intense color with increasing value).
