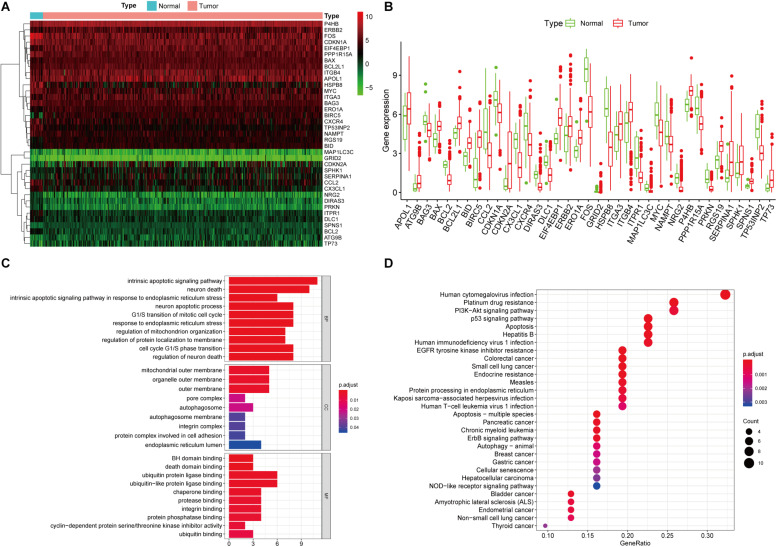
FIGURE 1.
Differentially expressed ARGs and functional annotation. (A) Heatmap of the differentially expressed ARGs. (B) The differentially expressed ARGs exhibited as a histogram. (C) GO enrichment analysis of differentially expressed ARGs. (D) KEGG pathway enrichment analysis of differentially expressed ARGs. The top 30 enriched pathways are shown.

