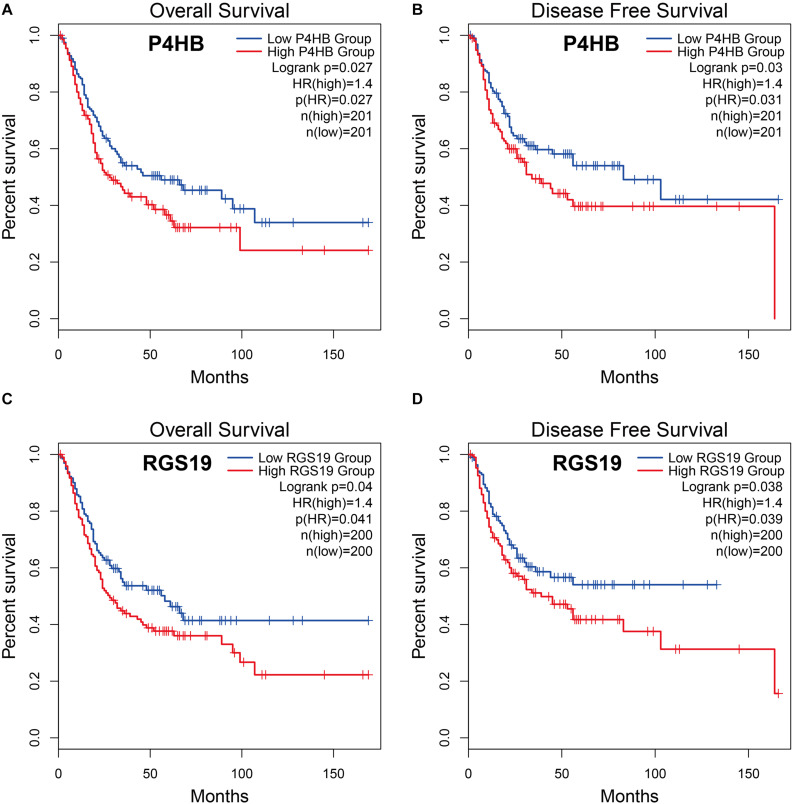
FIGURE 2.
Relationship between P4HB and RGS19 expression and prognosis in BUC patients. (A,B) Kaplan-Meier survival curves of OS and DFS comparing patients with high (red) and low (blue) expression of P4HB in BUC. (C,D) Kaplan-Meier survival curves of OS and DFS comparing patients with high (red) and low (blue) expression of RGS19 in BUC.

