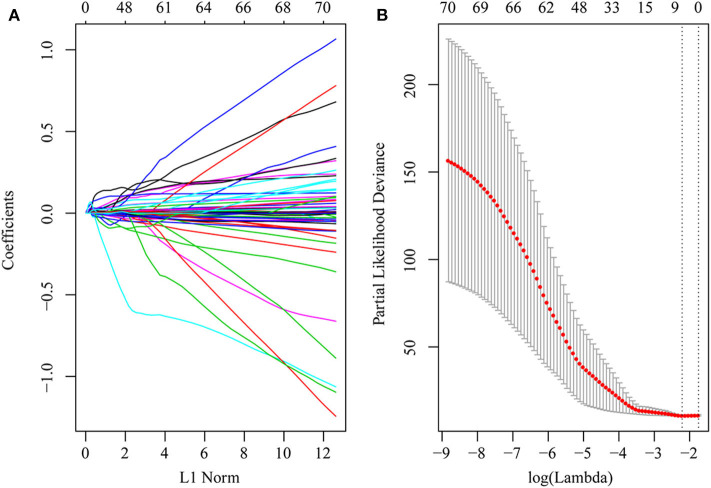
Figure 4.
DEGs in univariate Cox regression with P-value of <0.01 were included in the LASSO-Cox regression model for variable compression to establish an optimal prognostic model. The model with lambda = 0.1093823 was selected as the final model. (A) LASSO-Cox regression coefficient selection and variable screening. The lower horizontal axis represents lambda value, and the upper horizontal axis scale represents the number of variables in the lasso-cox regression model, the regression coefficient (x) of which is not 0. The left vertical axis represents the value of the regression coefficient (x). (B) Cross-validation in the LASSO-Cox regression model to select the tuning parameter. The horizontal axis represents the log (lambda) value, and the vertical axis represents partial likelihood deviance. The red dots in the figure represent partial likelihood deviations ± standard error for different tuning parameters.

