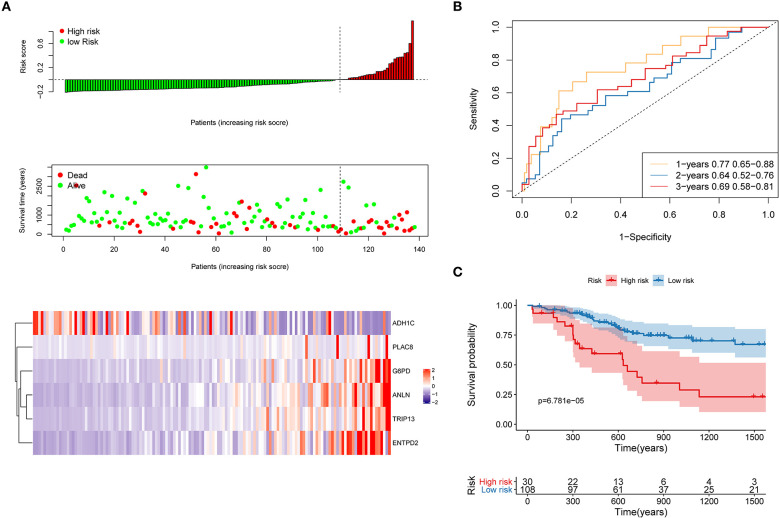
Figure 8.
Internal validation of the risk model. (A) Distribution of risk score, OS, survival status (red dots indicate death, blue dots indicate alive) and the six genes expression heat map in the internal validation cohort; (B) ROC curves and AUC for 1-, 2-, and 3-year survival in the internal validation cohort of the risk model; (C) KM curves of the OS in the internal validation cohort.

