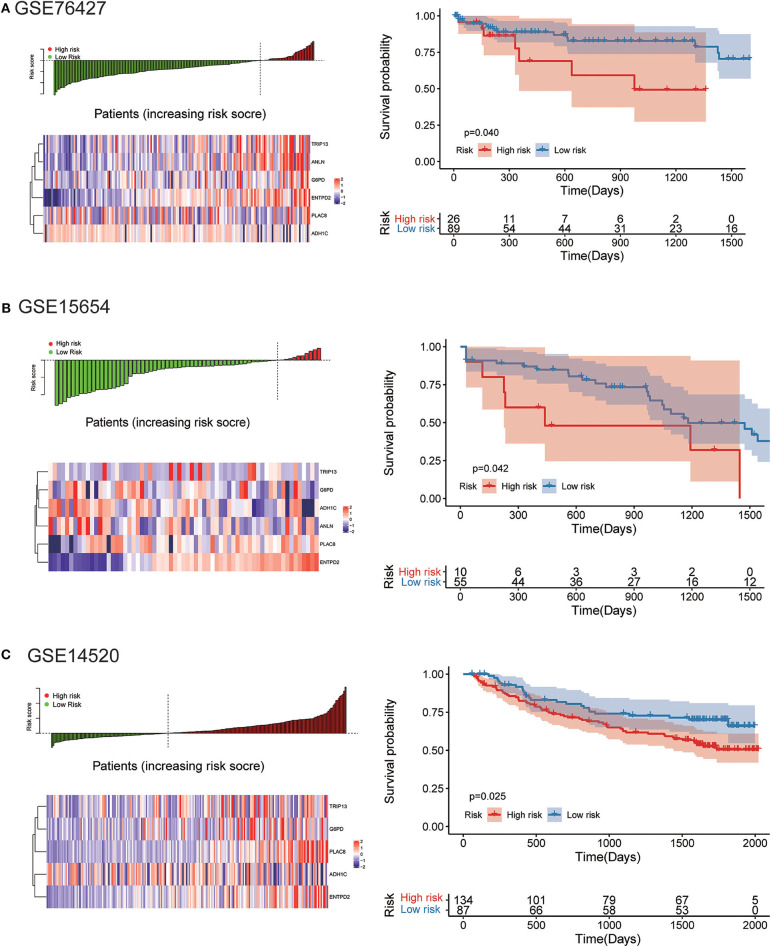
Figure 9.
External validation of the risk model in GSE76427, GSE15654, and GSE14520 datasets. (A) The distribution of risk score, six genes expression heat map, and the KM curves of the OS in the GSE76427 validation cohort. According to the risk score, the patients were divided into the high-risk group and low-risk group in the GSE76427 dataset; (B) The distribution of risk score, six genes expression heat map, and the KM curves of the OS in the GSE15654 validation cohort. According to the risk score, the patients were divided into the high-risk group and low-risk group in the GSE15654 dataset; (C) The distribution of risk score, six genes expression heat map, and the KM curves of the OS in the GSE14520 validation cohort. According to the risk score, the patients were divided into the high-risk group and low-risk group in the GSE14520 dataset.

