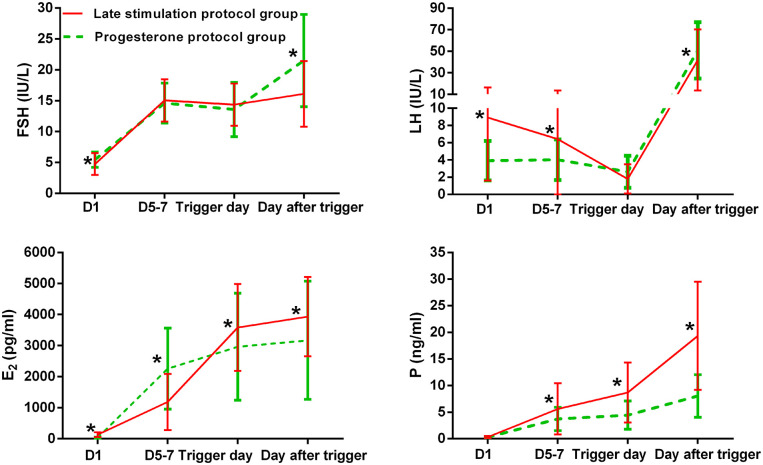
Figure 2.
Serum hormonal profiles during ovarian stimulation in the two groups. The green lines represent the control group (progesterone protocol group), and the red lines represent the study group (late stimulation protocol group). *Time point at which P < 0.05. The initial day of ovarian stimulation is denoted as day 1 (D1). FSH, follicle-stimulating hormone; LH, luteinizing hormone; E2, estradiol; P, progesterone.

