Figure 1.

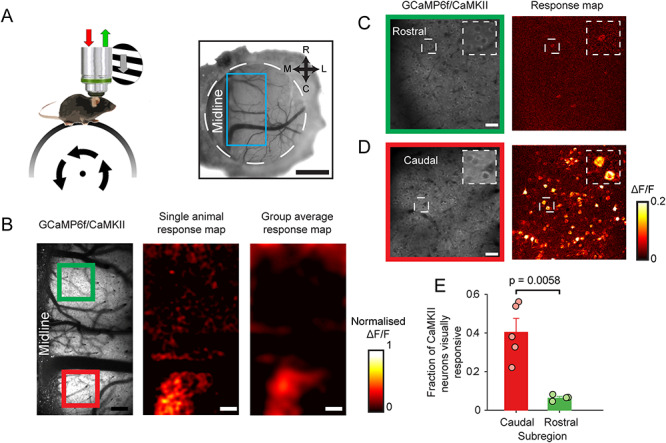
Localization of visually responsive area of dysgranular RSC. (A) Setup schematic (left) and cranial window over RSC (right). Blue box indicates area imaged. Scale bar: 1 mm. (B) Low magnification 2-photon visual response maps showing visually evoked activity of CaMKII neurons in the cRSC (red box) but not rRSC (green box). Scale bar: 160 μm. (C,D) Higher magnification of rostral (C) and caudal (D) regions showing visually responsive neurons in caudal but not rostral areas. Scale bar: 30 μm. (E) Mean fraction of visually responsive neurons (error bars represent SEM) detected in caudal and rostral areas.
