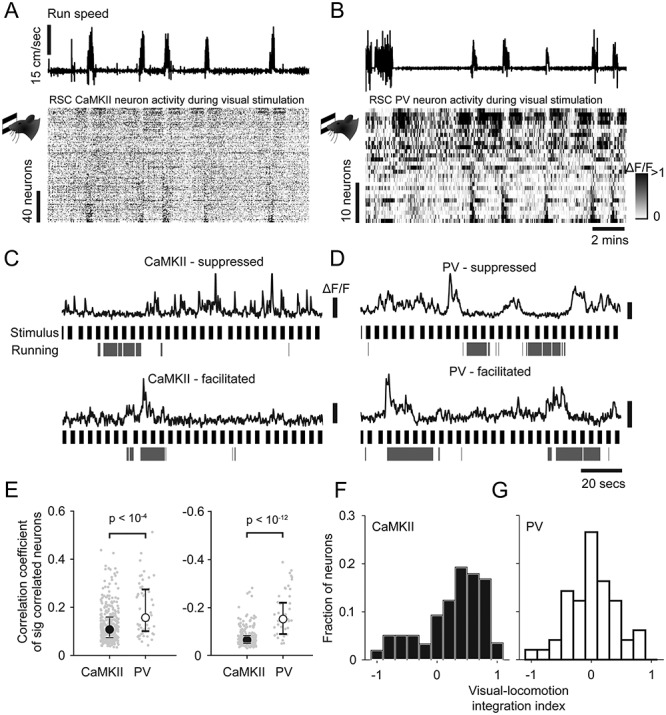
Figure 5.

Interaction of visual and locomotion induced activity in CaMKII and PV neurons. (A,B) Run speed, and below, raster representation of neural activity during visual stimulation sorted by run speed correlation in CaMKII neurons (A) and PV neurons (B). (C,D) Example traces of running suppressed (upper) and running facilitated neurons (lower) during visual stimulation, together with running periods and stimulus onset times (black) in CaMKII neurons (C) and PV neurons (D). (E) Median run speed correlations during visual stimulation of significantly positively and negatively correlated neurons (left and right respectively). Error bars indicate interquartile range. (F,G) Histogram of indices of visual-locomotion integration of CaMKII (black, F) or PV (white, G) neurons.
