
Figure 6.
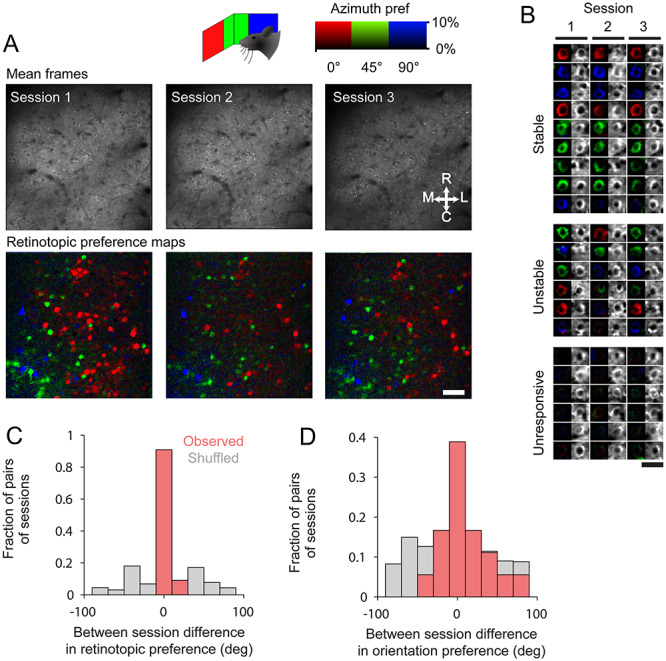
Longitudinal stability of retinotopic positional preference in cRSC neurons over weeks. (A) Single field of view imaged over three sessions spread over 4 weeks, showing mean imaging frame (above) and pixel-wise azimuth retinotopic preference map (below). Scale bar: 30 μm. (B) Examples of longitudinally tracked neurons, which have stable visual responses, unstable responses or were stably unresponsive. (C,D) Between session difference in retinotopic preference (C) and orientation preferences (D) for each neuron on each pair of sessions on which it was measured.