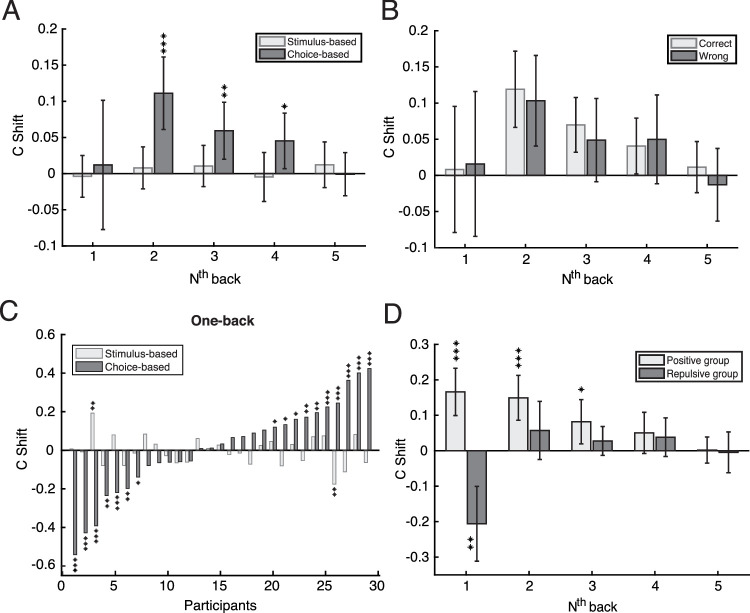
Figure 3.
Results from the analysis of serial dependence for Experiment 1. Error bars represent 95% confidence intervals. Symbols ***, **, and * indicate p < 0.001, p < 0.01, and p < 0.05, respectively. (A) Group mean serial dependence based on the previous stimulus (light gray bars) and choice (dark gray bars). The x-axis indicates the analysis on N trials back from the current trial. The y-axis is the serial dependence index (c shift), with a positive value meaning a positive serial dependence. (B) The choice data from panel A split by whether the previous choice was correct (light gray bars) or incorrect (dark gray bars). (C) The one-back serial dependence effect calculated on previous stimulus (light gray bars) and choice (dark gray bars) for each participant. (D) The choice-based, one-back data from panel C, grouped by whether the sign of serial dependence was positive (n = 17: light gray bars) or negative (n = 12: dark gray bars), showing the persistence of the effects over 1 to 5 trials back.

