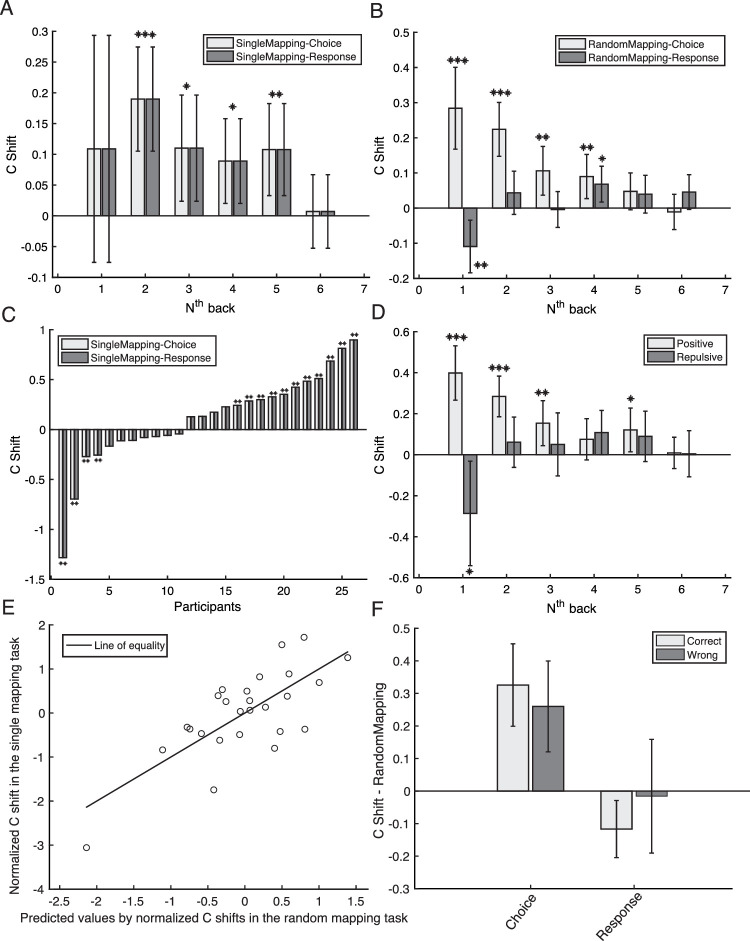
Figure 4.
The analysis results on serial dependence for Experiment 2. Error bars represent 95% confidence intervals. Symbols, ***, **, and *, mean p < 0.001, p < 0.01, and p < 0.05, respectively. (A) The serial dependence on previous choice (light gray bars) and response (dark gray bars) in the single mapping task. The x axis indicates the analysis on N trials back from the current trial. The y axis is the serial dependence index (C shift), with a positive value meaning positive serial dependence. (B) The serial dependence on previous choice (light gray bars) and response (dark gray bars) in the random mapping task. The x axis indicates the analysis on N trials back from the current trial. The y axis is the serial dependence index (C shift). (C) Serial dependence on previous one-back choice (light gray bars) and response (dark gray bars) for each participant in the single mapping task. (D) Persistence of serial dependence for two groups of participants in the single mapping task: one with positive serial dependence on the one-back choice (light gray bars) and the other with negative serial dependence on the one-back choice (dark gray bars). (E) The multiple regression result. The y axis indicates participants’ one-back C shift (normalized) in the single mapping task. The x axis represents the predicted values of participants’ normalized one-back C shift in the single mapping task by their one-back serial dependence on the choice and the response (normalized) in the random mapping task. Each circle represents one participant. (F) The one-back serial dependence in the random mapping task split by whether the previous choice was correct (light gray bars) or incorrect (dark gray bars).

