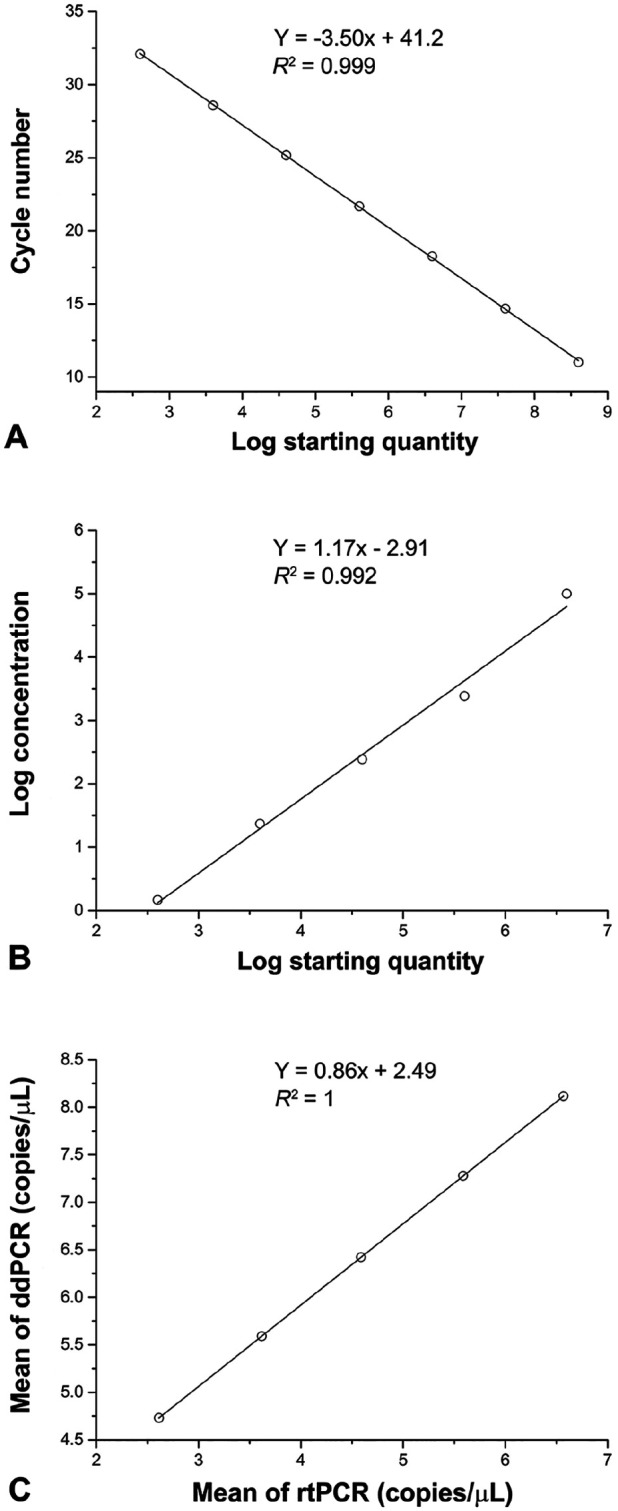
Figure 3.

Sensitivity comparison between droplet digital PCR (ddPCR) and real-time PCR (rtPCR) using serially diluted porcine epidemic diarrhea virus (PEDV) plasmids. A. rtPCR standard curve generated from a 10-fold dilution series of PEDV plasmids. The quantification correlation was obtained by plotting the quantification cycle value against the log starting concentration. B. Standard curve generated by ddPCR. The quantification correlation was obtained by plotting the log absolute concentration against the log starting concentration. C. Quantitative correlation of mean values for each concentration of PEDV plasmids between ddPCR and rtPCR methods.
