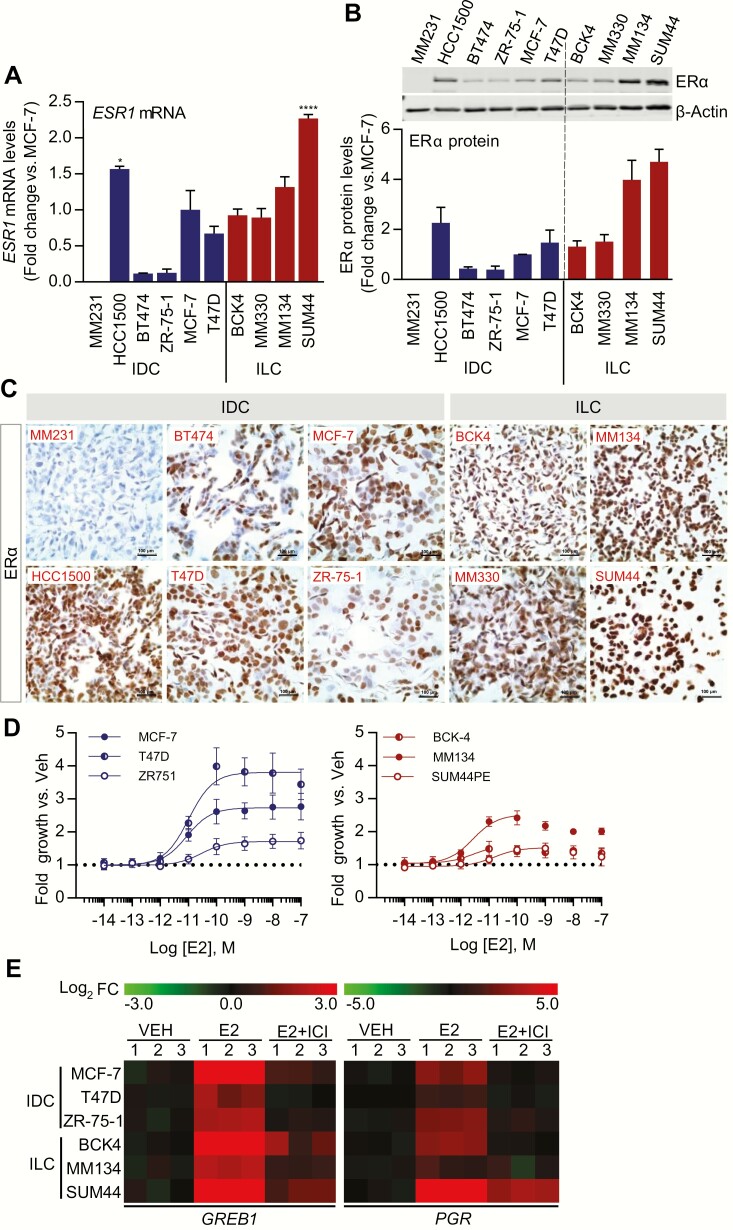
Figure 2.
ERα protein levels and estrogen response in ILC and IDC cell line models. A: Expression of ESR1 mRNA in IDC and ILC cell lines. Cell lines were grown in standard culture conditions and ESR1 mRNA levels were quantified by qRT-PCR. Data are shown as mean ± SEM from 3 biological replicates. *P < 0.05; ****P < 0.0001; calculated by 2-way ANOVA followed by Dunnett’s multiple comparison test; comparing the ESR1 mRNA levels to that of MCF-7. B: Expression of ERα protein in IDC and ILC cell lines. Western blot analysis of ERα in total protein extracts from IDC and ILC cell lines. The protein quantity is expressed as average fold change versus MCF-7 cells. Results represent the mean ± SEM of 3 independent experiments. C: Pelleted, fixed, and paraffin-embedded cells were immunostained for ERα. Representative images taken at 40x objective are shown (scale bar = 100 μM). D: Effect of 17β-estradiol (E2) on growth of IDC and ILC cell lines. Hormone-deprived cell lines were treated with Vehicle (Veh, 0.01% DMSO) or increasing doses of E2 (10–14 to 10–7 M) for 6 (MCF-7, T47D) or 7 (ZR-75-1, BCK-4, MDA-MB-134-VI, SUM44) days and proliferation assessed by FluoReporter® Blue Fluorometric dsDNA Quantitation Kit. Data are shown as fold growth versus Veh control. Points represent the mean of 6 biological replicates; error bars denote SD. E: Heat maps depicting gene expression changes (log2 fold change [FC] vs Veh) after treatment with E2 ± ICI 182,780 in IDC and ILC cell lines. Cell lines were hormone-deprived and treated with Veh or 1 nM E2 ± 1 μM ICI 182,780 for 6 hours. GREB1 and PGR mRNA levels were quantified by qRT-PCR. Data expressed as log2 FC versus Veh from 3 biological replicates.

