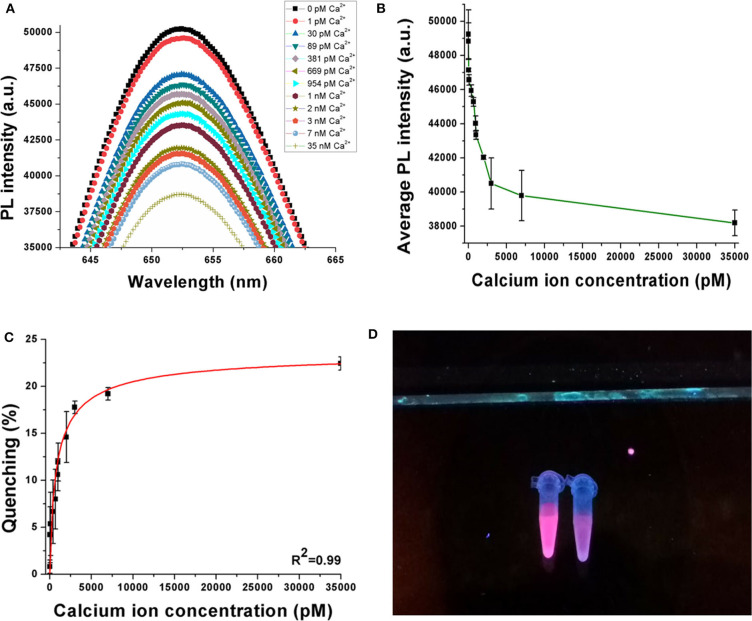
Figure 3.
(A) Decrease in PL intensity with increase in Ca2+ concentration. (B) Average PL intensity curve of the sensor when experiments are repeated with multiple samples. (C) Quenching behavior of the sensor when the concentration of Ca2+ is increased up to 35 nM. (D) Visual illustration of quenching phenomena in the sensor on addition of target ion. Experiments have been conducted in quintuplicates (n = 5).

