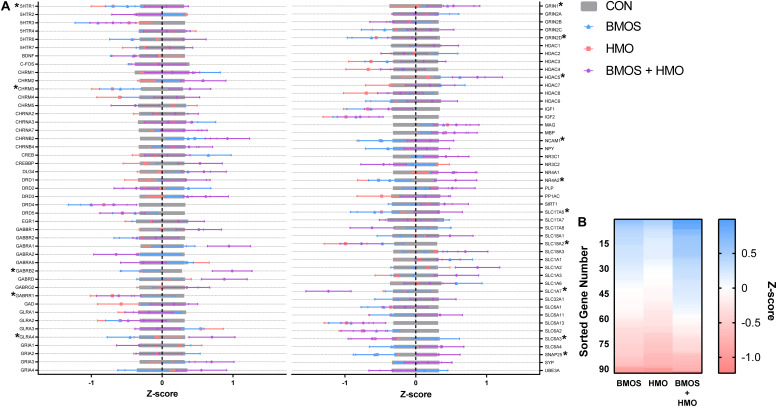
FIGURE 6.
(A) Hippocampal tissue was assessed for the mRNA expression of 93 genes. Figure depicts standardized data (mean = 0, standard deviation = 1) centered by control group. Values below zero indicate decreased expression compared to control, whereas values above zero indicate increased expression. Bars show mean ± standard error, genes significantly impacted by diet are denoted by an asterisk. Accession numbers for each gene can be found in Supplementary Table 6. (B) Genes were sorted in descending order by Z-score for each diet, visualizing the trend where the HMO group exhibited greater downregulation of mRNA compared to the BMOS or BMOS + HMO group. CON, control group; BMOS, pigs fed a mixture of bovine milk oligosaccharides; HMO, Pigs fed 2’-fucosyllactose + Lacto-N-neotetraose; BMOS + HMO, pigs fed both human and bovine milk oligosaccharides.

