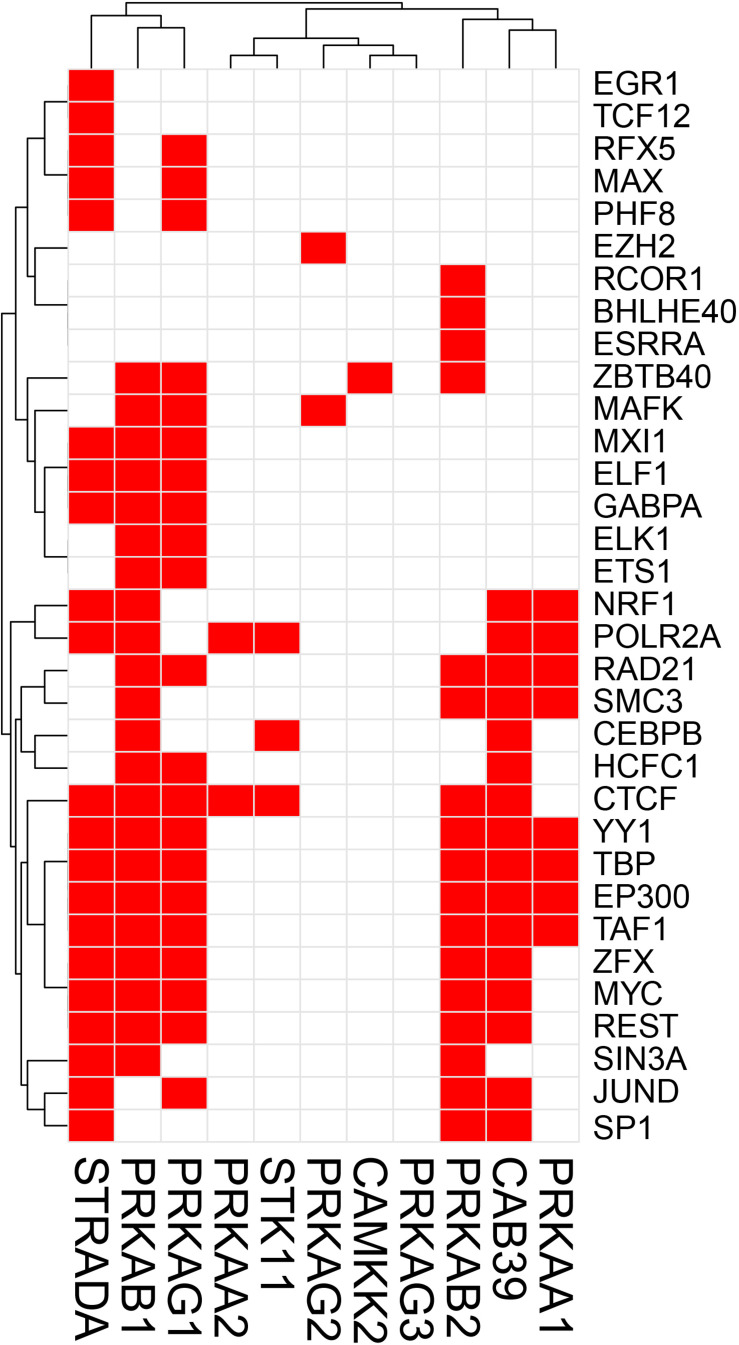
FIGURE 1.
Heatmap-style “occurrence” plots of putative AMPK family TFs. The occurrence plot is an intuitive way to visualize co-regulated genes whose expressions are controlled by the same TF(s). Briefly, we assigned “1” if the binding site(s) of a given TF’s (right) are reported “at least once” (in ENCODE) within a reasonable distance from the transcription start site (TSS) of a gene (bottom). Otherwise, we assigned “0” (i.e., no TFBS within a given range). The result is a matrix filled with 0 (w/o TFBS) and 1 (w/TFBS). The trees on the top and the left sides were generated using the hierarchical clustering based on vectors in rows and columns. AMPK pathway genes and TF-binding peak occurrence are shown in the promoter regions. Each red cell represents a gene with at least one binding sites of a given TF within 2 kb-upstream and 1 kb-downstream from its TSS.

