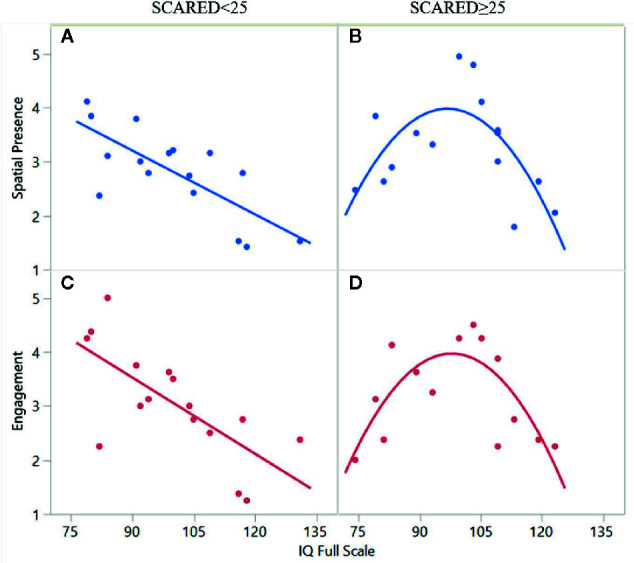
Figure 2.

The association between full-scale IQ and spatial presence/engagement in two subgroups of participants: panels A and C depict a linear association for participants without anxiety (SCARED>25) and panels B and D depict a quadratic function for participants with anxiety (SCARED>25).
