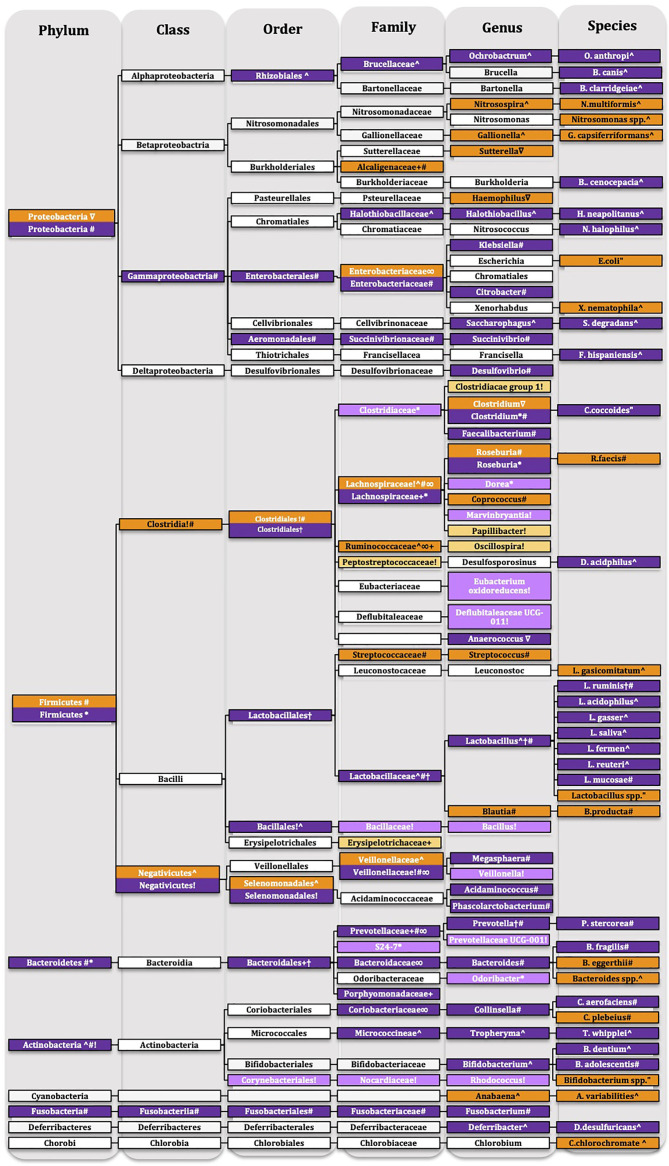
Figure 6.
Taxonomic tree of schizophrenia. Showing reduced abundance in orange, increased abundance in purple with lighter shades of orange and purple to signify that only preclinical evidence is available. White-no change only for representative purposes. Ultrahigh-risk individuals †(4), first episode psychosis ^ (54), first episode schizophrenia “(55), chronic schizophrenia # (57) ∇(56) ∞(40), maternal immune activation model + (53), pharmacological model * (52), social isolation! (46).

