Figure 1.
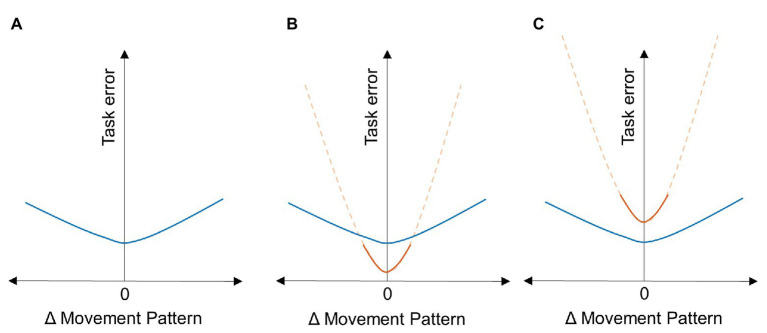
Flexibility, movement variability, and task performance. The plots indicate potential relations between the task error and the change from a preferred movement pattern. (A) Flexibility can be measured at an individual level by measuring the “flatness” of this curve (indicated in blue). An individual with greater flexibility will have a flatter curve indicating that they are capable of using multiple movement solutions to achieve (approximately) the same task error. However, comparisons between-individuals provide greater insight into whether this flexibility comes at a cost. An individual with lesser flexibility (indicated in red) is shown with a smaller range of movement variability (solid line) and the extrapolation of this curve to the same range as the more flexible individual (dashed line). The relative positions of these two individuals on the task error axis can reveal the potential cost of flexibility. (B) If the more flexible individual has higher task error, then flexibility comes at the cost of lower task performance. (C) However, if the more flexible individual has lower task error, then it suggests that greater flexibility can potentially lead to finding solutions with higher task performance.

