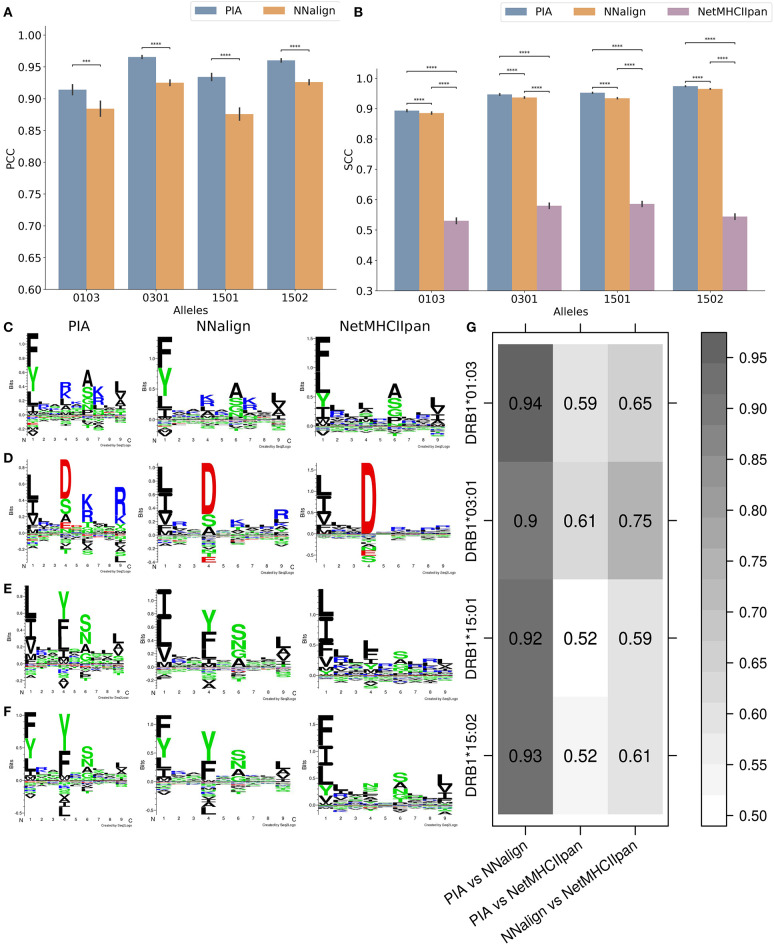
Figure 1.
Performance of the models on peptide microarray data and resulting motifs. (A) The Pearson correlation coefficient (PCC) and (B) the Spearman correlation coefficient (SCC) on the independent test dataset of the peptide microarray are shown. The pairwise p-values were calculated using a non-parametric bootstrap hypothesis test with 1,000,000 bootstrap iterations. *0.01 < p ≤ 0.05, **0.001 < p ≤ 0.01, ***0.0001 < p ≤ 0.001, and ****p ≤ 0.0001. Motif plots of (C) DRB1*01:03, (D) DRB1*03:01, (E) DRB1*15:01, and (F) DRB1*15:02 based on the top 1% (from a pool of 100,000 random natural peptide) binding peptides generated with the deep learning model (PIA), NNAlign model and NetMHCIIpan-3.2 (8). (G) Pearson correlation coefficient (PCC) of the position specific scoring matrices (PSSM) between the different models.

