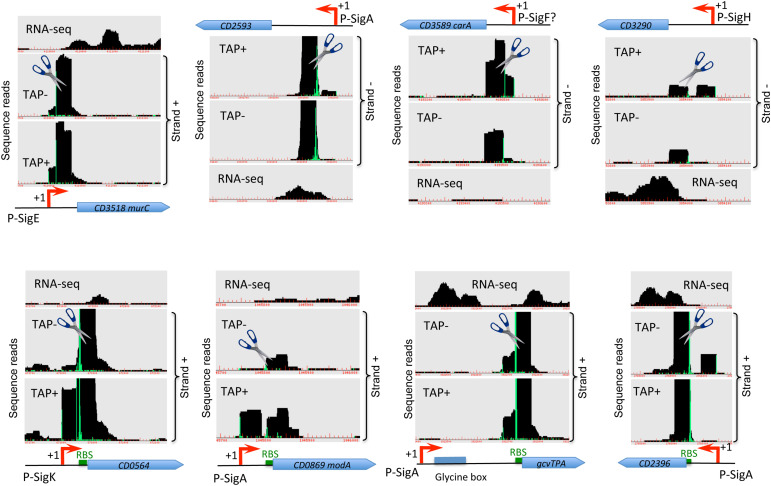
FIGURE 2.
Examples of cleavage sites detected by TSS-mapping. Representative examples of 5′-end RNA-seq (TAP-/TAP+ profile comparison) and RNA-seq data for potential processing profiles are shown. The RNA-seq and 5′-end RNA-seq data visualization is presented as in Figure 1. Potential cleavage site shown by scissors mark corresponds to a position with large number of reads in both TAP– and TAP+ samples. RBS are shown by green boxes to highlight the positions of potential cleavage sites in the proximity or inside RBS.

