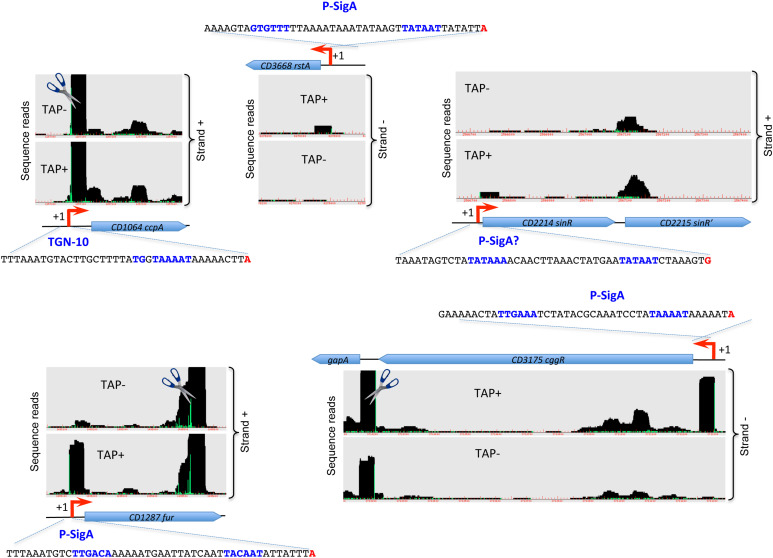
FIGURE 3.
Examples of promoters controlling regulatory genes detected by TSS-mapping. Representative examples of 5′-end RNA-seq (TAP–/TAP+ profile comparison) data for the identification of TSS for genes encoding important transcriptional regulators are shown. The 5′-end RNA-seq data visualization is presented as in Figure 1. The sequence of promoter region is shown upstream of TSS with the –35 and –10 promoter elements indicated in blue and TSS indicated in red.

