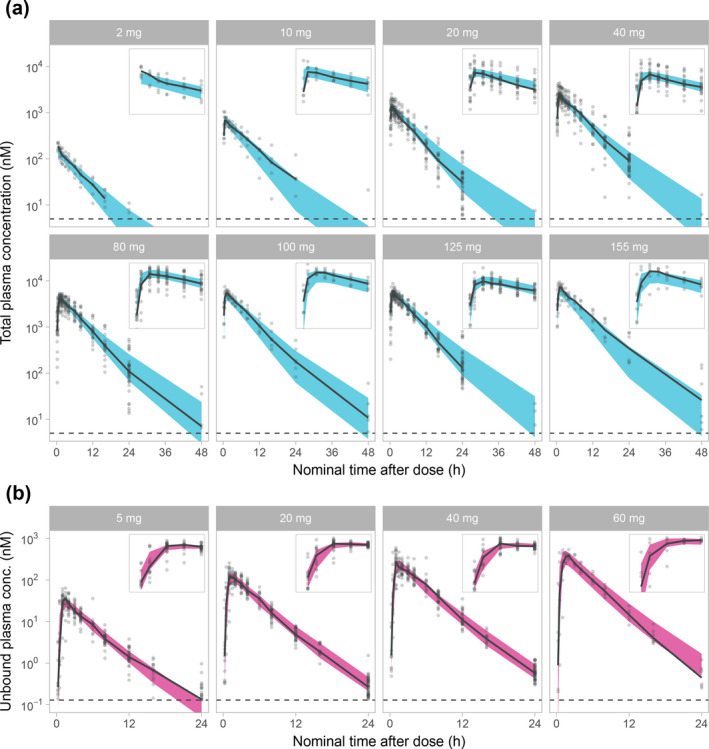
Figure 1.

Visual predictive checks on a logarithmic scale, stratified on dose for the AZD9567 pharmacokinetic (PK) model (a) and the prednisolone PK model (b). Plots are showing the 95% confidence interval for the model median (blue for AZD9567, red for prednisolone), observed individual data (gray dots) and their median (solid black line), and the lower limit of quantification (dashed black line). Insets are showing a magnification of the first 4 hours after dose. The y‐scale of the insets are different but always show a 10‐fold range for AZD9567 and a 1,000‐fold range for prednisolone.
