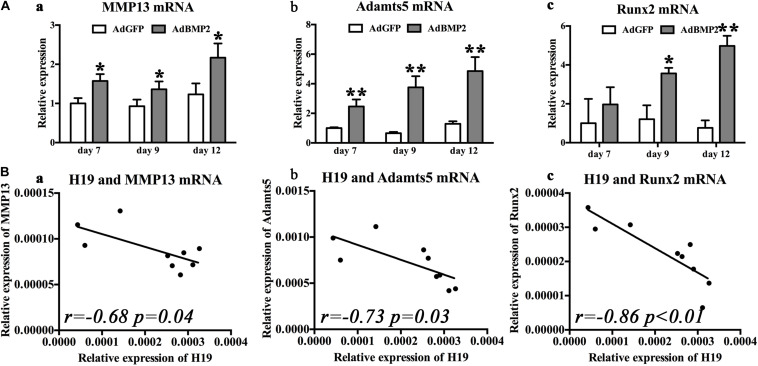
FIGURE 3.
Bone morphogenetic protein 2 (BMP2) induced H19 expression is negatively correlated with hypertrophic differentiation markers. (A) BMP2-induced hypertrophic differentiation of mesenchymal stem cells (MSCs). Quantitative PCR (qPCR) analysis of MMP13 (a), Adamts5 (b), and Runx2 (c) messenger RNA (mRNA) expression levels at days 7, 9, and 12 with the stimulation of AdBMP2; AdGFP was used as control. (B) The correlations between BMP2-induced H19 expression level and hypertrophic differentiation markers expression levels. The correlations between H19 expression levels of MMP13 (r = −0.68, p = 0.04) (a), Adamts5 (r = 0.73, p = 0.03) (b), and Runx2 (r = −0.86, p < 0.01) (c) mRNA expression levels at days 7, 9, and 12 were calculated with Spearman’s correlation coefficients. “*” and “**” respectively mean p < 0.05 and p < 0.01 compared with AdGFP group; r means correlation coefficients. Each assay was done in triplicate and/or carried out in three independent experiments at least.

