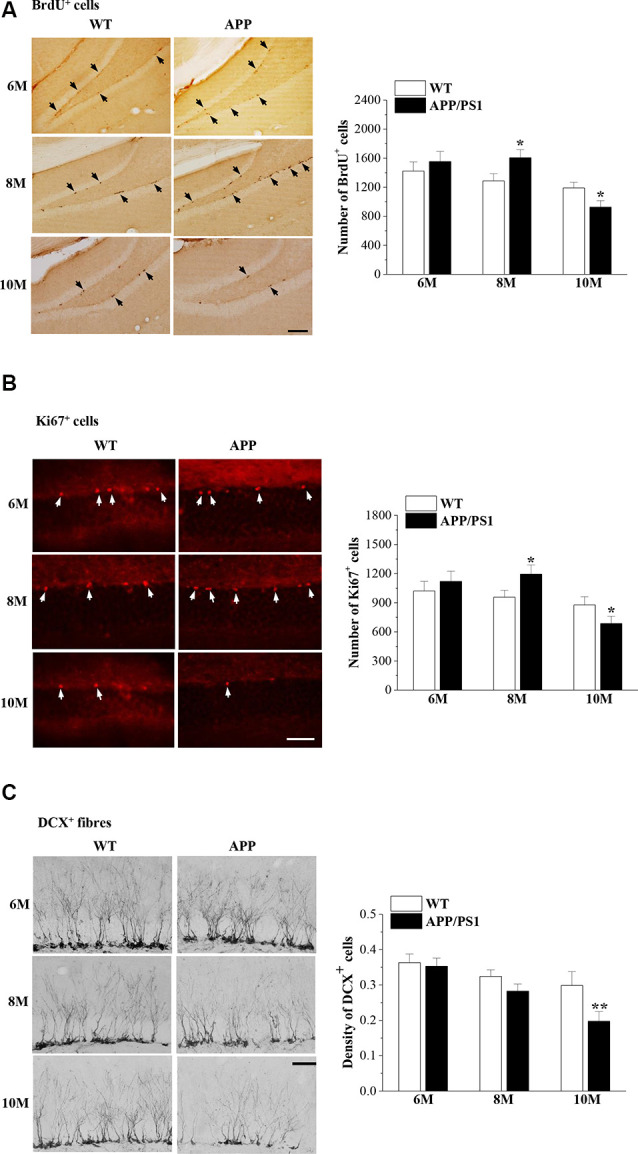
Figure 2.

Abnormal neurogenesis in the dentate gyrus (DG) of APP/PS1 mice. (A) Representative images of 5-bromo-2′-deoxyuridine (BrdU) immunostaining in 6-month-old, 8-month-old, and 10-month-old APP/PS1 mice and age-matched wild-type (WT) mice (upper panels). BrdU+ cells are indicated by black arrows. Scale bar = 50 μm. The bar graphs show the mean number of BrdU+ cells in APP/PS1 mice and WT mice. *P < 0.05 vs. age-matched WT mice (Student’s t-test). (B) Ki67 immunostaining in 6-month-old, 8-month-old, and 10-month-old APP/PS1 mice and age-matched WT mice (upper panels). Ki67+ cells are indicated by white arrows. Scale bar = 50 μm. The bar graphs show the mean number of Ki67+ cells in APP/PS1 mice and WT mice. *P < 0.05 vs. age-matched WT mice (Student’s t-test). (C) Representative pictures of doublecortin (DCX) immunostaining in 6-month-old, 8-month-old, and 10-month-old APP/PS1 mice and age-matched WT mice (upper panels). Scale bar = 50 μm. The bars indicate the mean density of DCX+ cells in APP/PS1 mice and WT mice. **P < 0.01 vs. 10-month-old WT mice (Student’s t-test).
