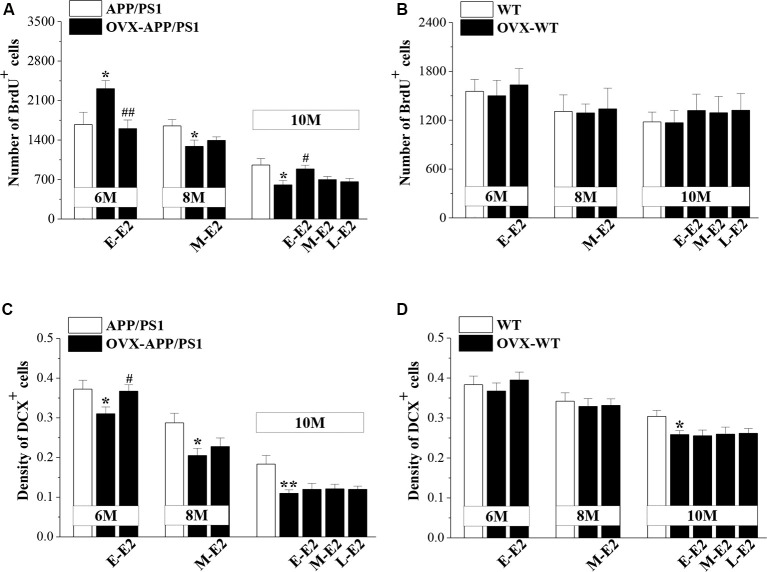
Figure 3.
Influence of E2 on the proliferation of neural stem cells (NSCs) and the survival of immature neurons in the DG of APP/PS1 mice. (A,B) Bar graphs showing the numbers of BrdU+ cells in APP/PS1 mice or WT mice that were sham-operated (sham-op; open bars) or OVX (black bars). *P < 0.05 vs. age-matched sham-op APP/PS1 mice; #P < 0.05 and ##P < 0.01 vs. age-matched OVX-APP/PS1 mice (two-way ANOVA). (C,D) The mean density of DCX+ cells in APP/PS1 mice or WT mice. *P < 0.05 and **P < 0.01 vs. age-matched sham-op mic; #P < 0.05 vs. 6-month-old OVX-APP/PS1 mice (two-way ANOVA).

